A New Way to Model Catastrophes in a Changing Climate
hen Dr. Kip Rotich was growing up in Nakuru, Kenya, the weather was on his side. The predictable rainy season meant that his family’s homestead could produce enough food to be self-sufficient, plus more in reserve. Now the rains are heavier and more damaging, with longer dry spells between.
“These days,” he says, “we’d be lucky to harvest a tenth of that, if any.”
Now as an actuary and quantitative analyst specializing in weather modeling, Rotich realized this wasn’t just family misfortune. It was also a data problem. How do you build and validate a catastrophe model when data is sparse and the future climate looks nothing like the past?
Rotich’s recently published Variance article, “An Application of Image Processing Techniques in the Calibration of Catastrophe Models,” suggests that neural networks trained on maps of historical storms may hold the key.
Classic methods exist to model natural catastrophes, which are, thankfully, still relatively infrequent events. One method uses generalized linear models (GLMs). These may produce reasonable results for perils like wind and hail, where data is plentiful, but struggle with hurricanes and other rare events.
But these models are only as reliable as the data and assumptions behind them.
Rotich writes, “…catastrophic weather-related events keep occurring more often than the current catastrophe models can predict.” Therefore, companies must calibrate the models based on knowledge of exposure changes, climate change, and their unique portfolios.
This model calibration often includes comparing an “out-of-the-box” vendor catastrophe model to company historical results and to simpler GLMs (tuned to the company’s book of business) and making ultimate selections for the relevant risk metric indications. Those comparisons and selections are then used to true-up the vendor catastrophe model.
Rotich suggests that using a neural network instead, which can be trained directly on images, may provide several distinct advantages in calibration: 1) it replaces entire ensembles of GLMs while requiring less computing power, 2) it produces robust results even when data is sparse, and 3) it outperforms GLMs across most metrics.
To make this approach accessible, Rotich includes a primer in his paper designed to “demystify” neural networks, particularly convolutional neural networks (CNNs). CNNs are the standard architecture for breaking an image into pixels and using specialized calculations to turn groups of pixels into modeling features. A subcategory of CNNs is CNNs with a U-net architecture — essentially a CNN with better “memory” that preserves image context that is lost in the standard CNN.
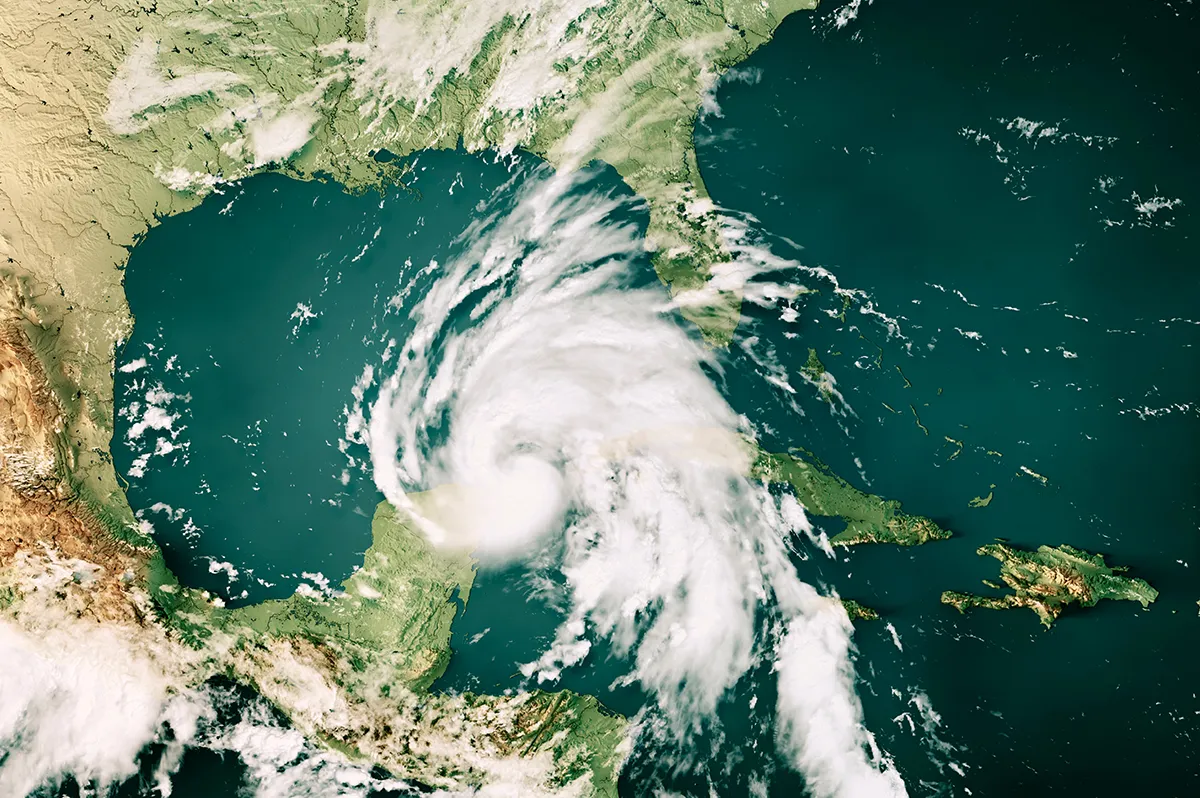
Data gathered from NOAA is used to create maps of catastrophic events (technically called 2D histograms), color coded by how frequently the event happens in a particular zone. The authors then evaluate the model using a rolling six-month forecast window, starting in 1950. This rolling series of maps is fed into the U-net CNN, which produces another 2D histogram as an output.
As Rotich viewed these maps, something clicked. “Catastrophe risk isn’t just about how much rain falls, but where and how the storm moves…tracking this movement gives a far more granular understanding,” he realized.
The U-net predictions can then be compared against output from catastrophe models and GLMs. Rotich found the U-net outperformed the GLM across most standard model metrics (MAE, Precision, Accuracy, etc.): “It was one of those moments where you think: OK, this isn’t just a proof of concept. There’s something genuinely powerful here.”
It also did a better job at picking up and predicting cyclicality of events when compared to the GLM, especially when the number of events was expected to be close to zero (which the GLM tends to overpredict). U-nets do this without being explicitly programmed to do so. Traditional GLMs, by contrast, “treat events as numbers,” Rotich explains. “They don’t see the shape or progression of a storm.”
More research remains. Rotich envisions linking hazard models to claims outcomes, testing newer architectures, and most importantly, accessing better data. “If I could get anything, it would be long, high-resolution, continuous spatial weather datasets such as radar, satellite, etc. That would unlock an entirely new level of precision,” Rotich says.
The U-net approach may prove particularly valuable for insurers entering new markets or testing catastrophe model assumptions against recent climate trends. For actuaries navigating catastrophic risk — whether in Kenya’s shifting rainy seasons or the Great Plains’ Tornado Alley — Rotich’s approach offers a way forward when the past is no longer indicative of the future.