

Catastrophe Modeling’s Evolution in a Changing World
ear after year, natural catastrophes that happen—or don’t—confound us. Several recent examples highlight the unpredictability of these events. For example, as of only eight months into 2026, both the number of fires and acres burned had already exceeded the 10-year average, according to the National Interagency Fire Center.1 Yet in 2025, no hurricanes made landfall in the U.S.—the first time since 2015. Climate uncertainty and volatility seem to be rewriting the rules of property insurance.
The Louisiana property insurance market is a prime example. During the 2020 and 2021 hurricane seasons, the state was pummeled by an unprecedented four major hurricanes. Homeowner’s insurance combined ratios exceeded 400% and triggered twelve carrier insolvencies over the following two years. This left many policyholders to the state’s insurer of last resort.2
Financial strain from catastrophes is being felt across the P&C insurance industry. Between 2015 and 2019, catastrophe losses contributed approximately 6.8% of the combined ratio on average. That same average percentage was closer to 12% in the period from 2020 to 2024.3 As the proportion of losses attributable to catastrophes grows, the importance of accurately pricing for these events only intensifies.
Traditional ratemaking relies on past loss experience to predict future loss experience. By relying on historical premiums and losses, actuaries can effectively price high-frequency, low-severity lines like personal automobile insurance. However, this retrospective approach misses the mark when applied to low-frequency, high-severity perils like hurricanes and wildfires. The rare nature of these extreme events means five, ten, or even 100 years of data may lack an ample amount of signal to reliably estimate future losses.
To address the gap of data for these rarer events, the industry turned to a forward-looking approach with catastrophe (CAT) modeling. Pioneered in 1987 when Karen Clark founded Applied Insurance Research (AIR), CAT modeling blends meteorology, seismology, structural engineering, and actuarial science to generate hundreds of thousands of plausible future scenarios. While early natural disaster simulations were developed in the mid-1900s, they were not adopted by insurance companies until decades later due to a perceived lack of necessity and technological limitations.
The shift in strategy came once Hurricane Andrew, a Category 5 storm, hit Florida in 1992. Howard Kunst, FCAS, MAAA, CCRMP, and chief actuary at Cotality, recalls that day: “When Hurricane Andrew hit, it was an event of proportions that nobody could ever have imagined was going to happen.” Causing around $15.5 billion in insured losses in 1992 dollars4 and leading to insolvency of at least sixteen insurance companies, the storm proved that only using historical data is insufficient for extreme right-tailed risk. Prior to Andrew, the largest insured loss from a hurricane was $4 billion when 1989 Hurricane Hugo hit South Carolina. While many traditional reinsurers estimated Andrew’s losses would not exceed $6 billion, Clark’s AIR model projected a $13 billion loss, validating the technology overnight. Thus, CAT models shifted from being a niche idea into a necessity for managing future catastrophic losses.
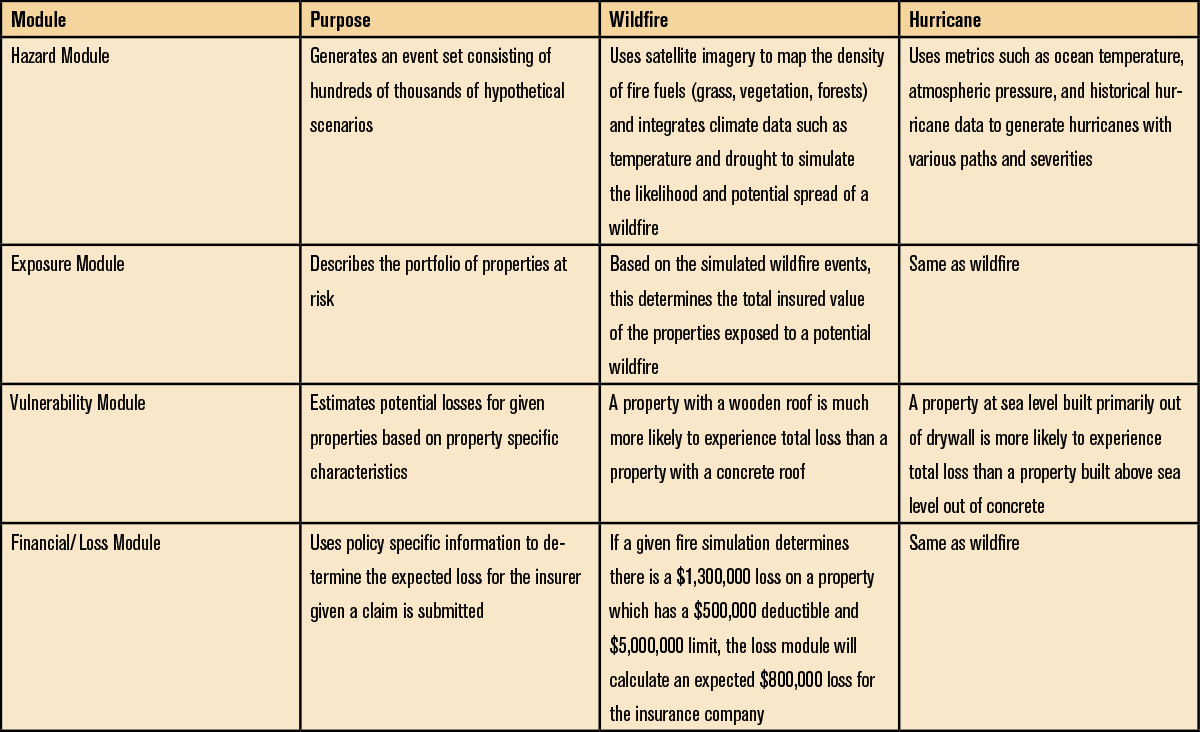
Modern CAT models do not generate a singular, absolute truth. Instead, proprietary CAT modeling technology vendors utilize a variety of data inputs and differing methodologies to provide platforms that insurers can run against their specific book of business. Some insurers create these models in-house. Despite differences in how these models are formed and what data goes into them, virtually all modern CAT models rely on four distinct modules: hazard, exposure/inventory, vulnerability, and financial/loss. (See Figure 1)
Peril-specific insights
Wildfires
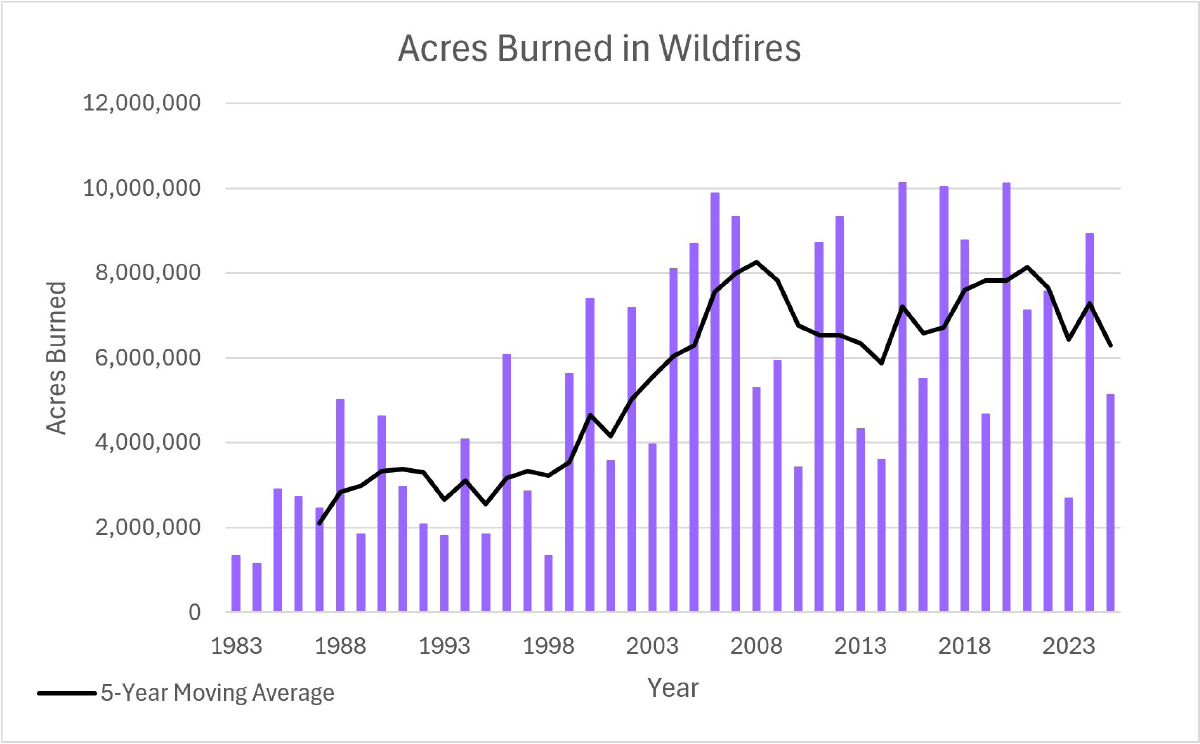
Can we therefore assume the increase in wildfires is due to global warming? We cannot make that conclusion as neatly as one might expect. One of the most difficult challenges of analyzing the effects of climate change on catastrophes is the inability to conduct a controlled experiment. There are multiple factors alongside climate that could affect wildfire frequency and severity. Infrastructure changes, like new roads, for example, could impact a fire’s ability to spread. Even legislative changes such as firework regulations and forestry management could alter the number of wildfires.
An increase in the population of the Pacific Northwest in recent years has also increased the risk of wildfire ignition. As studies have shown, 85%-90% of wildfires are estimated to be caused by humans. The increase in suburban sprawl results in more people moving into wildland-urban interfaces (WUI)—zones of land where human development meets undeveloped wildland vegetation—and are a hotbed for wildfire activity. Many of the most catastrophic wildfires in the last decade were WUI wildfires, including the 2018 Camp Fire in Paradise, California, and the 2023 Maui Wildfires in Hawaii.
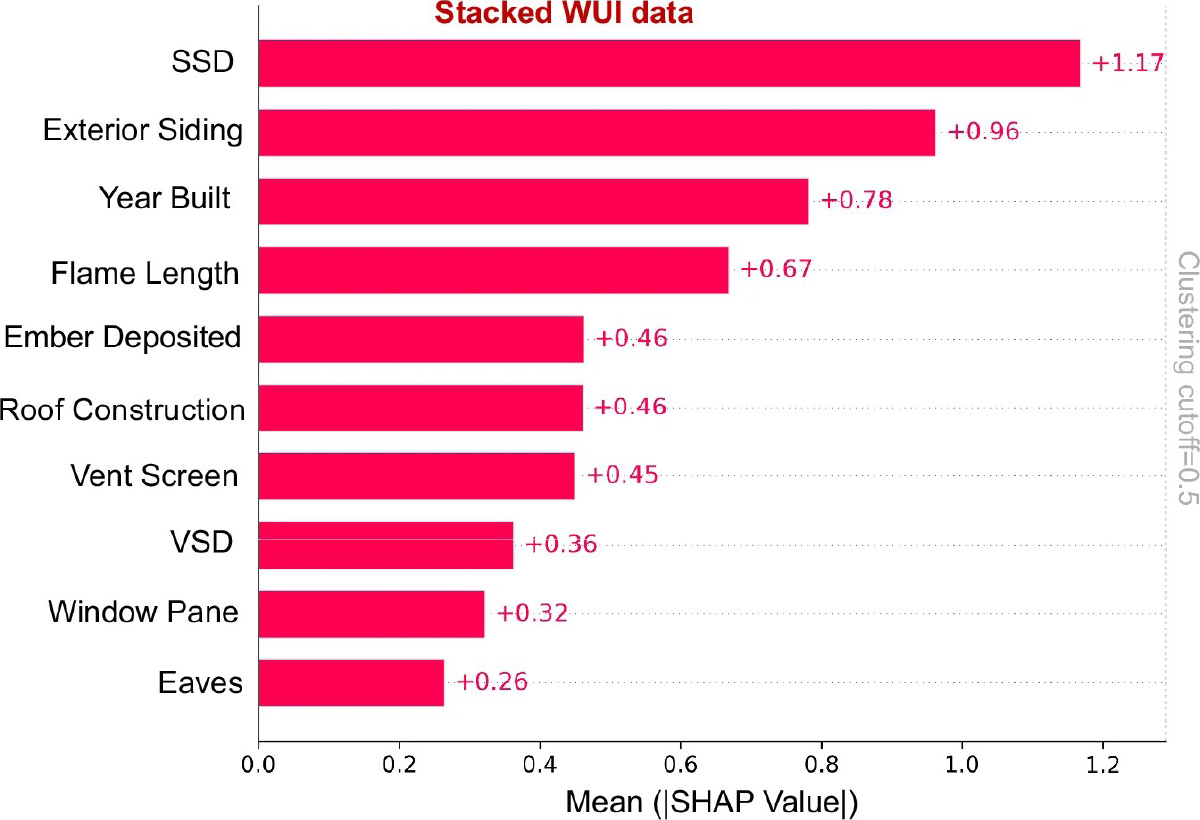
In a machine-learning analysis6 of five major California WUI wildfires—2017 Tubbs, 2017 Thomas, 2018 Camp, 2019 Kincade, and 2020 Glass Fires—researchers found distance between structures (SSD) to be the most important determinant of structure survivability. The remaining significant predictors underscore the “importance of hardening structures, structure density, and building arrangements in WUI areas to mitigate fire risk and potential destruction.” The results from this study support the strong focus placed on accounting for mitigation efforts in wildfire CAT models, at the individual property owner as well as at the community and state level. (See Figure 3.)
Hurricanes
Moreover, according to the NOAA, “On the century time scale (e.g., since 1900), there has been no significant trend in annual numbers of U.S. landfalling tropical storms, hurricanes, or major hurricanes.” (See Figure 4.)
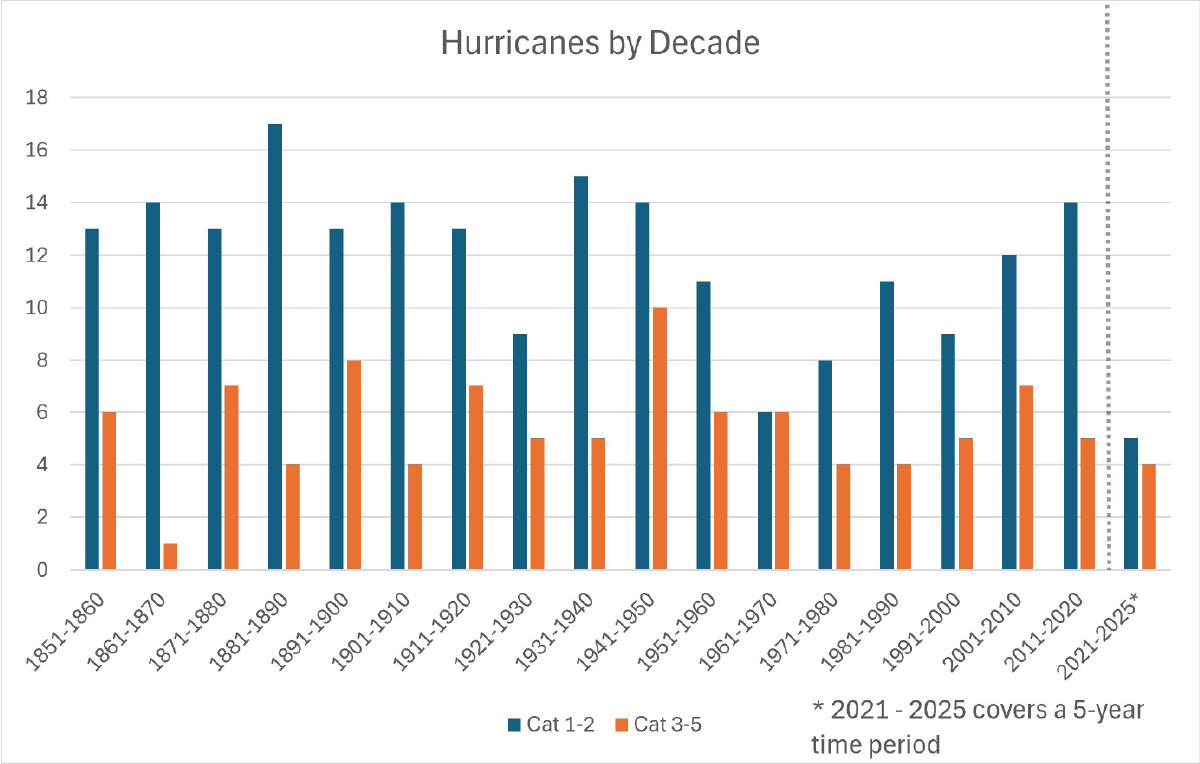
How do actuaries make sense of these conflicting data points? Despite science suggesting that hurricanes should be increasing in intensity (i.e. seeing more Cat 3-5 storms than Cat 1-2 storms) the data show no significant increase over the last 170 years. According to Kunst, “there is definitely debate among actuaries, but most people believe there should be some degree of increase in hurricane severity.”
On the surface, that set of 170 years of hurricane data may seem sufficient to identify trends. There have only been approximately 300 hurricanes to make landfall during this time, however, so it is reasonable to believe there is a trend that hasn’t had enough time to present itself in the data yet. Jamie Rodney, the CEO of Reask, believed as much, and decided to simulate an increase in hurricane frequency to determine how apparent a true increase in frequency would be visible in the data.8 Using a Poisson model in which hurricane frequency increases from 2 to 2.4 events per year over a 50-year period, 20% of simulations were unable to detect a positive trend after 80 years. Therefore, even a large (20%) increase in hurricane frequency over a relatively short (50 years) period of time will often not present itself in the data until many decades later.
As examples show that historical experience is not likely a reliable basis for CAT models, the insurance industry is adapting its models for current and future risks to better price policies and set reserves with greater confidence. This is important from an individual lens as insurers can realize more profit. It is also crucial on a larger scale. Better risk prediction means companies may refrain from finding service areas uninsurable, leaving markets entirely similar to insurers’ exodus after the California wildfires.
If insurers do leave a market, however, they may still be aware of potential risks and therefore able to provide better aid to insurers of last resort (ILRs). Since ILRs are legally required to stay in an particular area, if they have insufficient funds to pay claims, insurers may be assessed to make up the difference to settle claims. Understanding potential risks helps insurers prepare in the event that they need to make emergency aid decisions.
Climate-conditioned models
In addition to RCPs, Global Climate Models (GCMs)10 provide a more physics-based approach to simulated data. They learn from physical processes such as wind, pressure, flooding, and temperature to solve equations surrounding fluid dynamics or heat dispersion. A GCM consists of four main climate components:11
- The atmospheric component, simulating the transport of heat and water around the globe.
- The land surface component, simulating surface characteristics like vegetation and snow cover.
- The ocean component, simulating the current movement of the ocean, which is the dominant reservoir of heat and carbon in the climate system.
- The sea ice component, simulating solar radiation absorption and air-sea heat and water exchanges.
Outputs from these components can be factored into newer models along with RCP data, such as in the form of a “climate module.” In the hypothetical climate module, diagnostic and prognostic metrics can be utilized in addition to the four aforementioned climate components. Diagnostic metrics include detecting statistically significant changes and then attributing how much of that change is due to unnatural causes. Prognostic metrics would help predict future climate, such as global warming trends, validated by hindcasts of 20th century climate change.
However, due to their complexity, GCMs require an enormous amount of computational power, requiring technological workarounds to make them feasible. Another issue with GCMs is that they struggle to provide granular data. They excel at predicting continents and regions, but cannot narrow their scope without significant tradeoffs. To address that shortcoming, different machine learning (ML) algorithms can scale GCM data down to precise levels, with some preliminary methods being quite attractive; however, these occasionally “smooth over” minor exposures and still require fine-tuning.
AI integration
One way AI is revolutionizing current processes is through damage assessment after CAT events. In the past, on-the-ground teams were deployed to survey damaged areas, which was a slow and potentially hazardous process. Now, satellite-based AI classification, illustrated in the Moody’s example below,12 can scan designated areas and rapidly detect and estimate structural damage. (See Figure 5.)
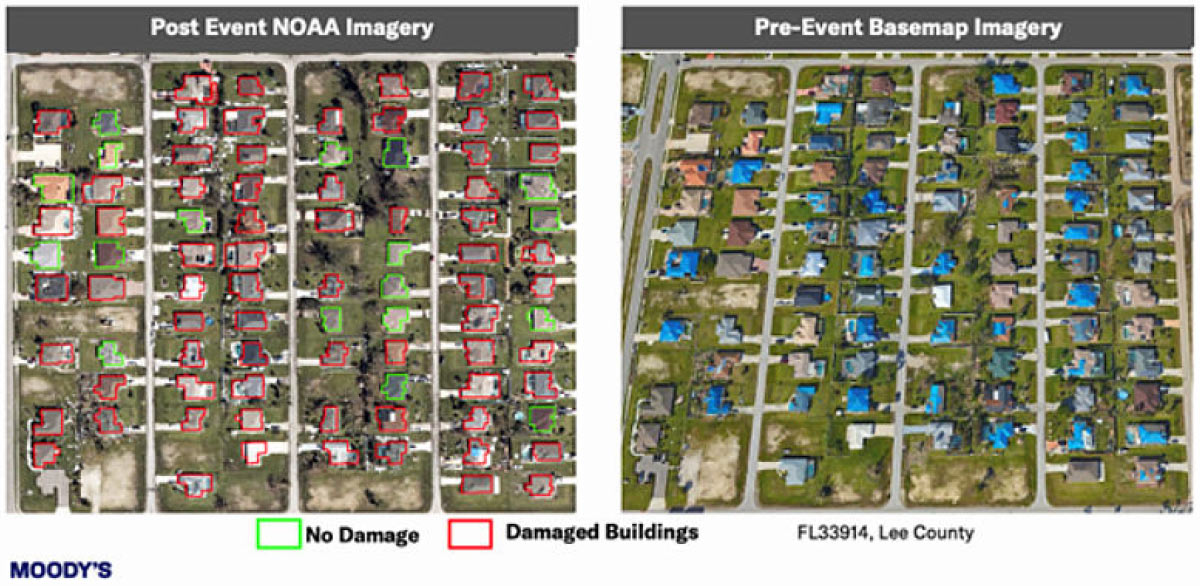
Despite the time and efficiency gains from the use of AI, it’s important to keep in mind the limitations and flaws of its use. Hallucinations can happen and go undetected, especially with a complex process like CAT modeling. Model output and events generated may seem reasonable on the surface, but break the laws of physics upon closer inspection. Additionally, AI methods aren’t designed to be fully reliable for edge cases—and as CAT modeling’s main focus is on extreme low-frequency, high-severity events, AI may fall short.
Conclusion
The evolution will require navigating complex variables because, while it’s simple to map a clear statistical trend for perils like wildfires, isolating the impact of climate change from human factors is not. Actuaries must reconcile instances in which science and historical data seemingly conflict, like navigating a sparse hurricane dataset that has yet to reflect increased hurricane severity from rising ocean temperatures. Ultimately, advanced predictive tools are not just technical upgrades. Achieving more accurate risk pricing allows insurance companies to maintain solvency and confidently serve insureds in volatile regions, rather than exit difficult markets entirely.
- https://www.axios.com/2026/08/03/us-wildfire-season-large-fires-10-year-average.
- https://www.iii.org/sites/default/files/docs/pdf/triple-i_trends_and_insights_louisiana_03282023.pdf.
- https://www.carriermanagement.com/news/2025/04/16/274239.htm.
- https://www.insurancejournal.com/news/national/2022/06/01/669875.htm.
- https://royalsocietypublishing.org/rstb/article/371/1696/20150178/22917/Increasing-western-US-forest-wildfire-activity.
- https://www.frontlinewildfire.com/wildfire-news-and-resources/wildland-urban-interface-wui-and-wildfire-risks/.
- https://www.nhc.noaa.gov/pdf/hurricaneStrikesByDecade.pdf.
- https://reask.earth/resources/tropical-cyclone-model-vs-observed-data.
- https://www.moodys.com/web/en/us/insights/announcements/rms-global-catastrophe-model-leader-launches-first-climate-change-models-enabling-new-risk-insights.html.
- https://users.ece.cmu.edu/~jhoe/distribution/mit/csgmemo/memo-425.pdf.
- https://www.gfdl.noaa.gov/climate-modeling/.
- https://www.moodys.com/web/en/us/insights/insurance/catastrophe-modeling-for-a-resilient-future-powered-by-ai.html.
- https://www.ft.com/content/347a6679-8301-4f89-8b5a-dffc54c7ea27?syn-25a6b1a6=1.