










Contents

departments
- EDITOR’S NOTE
- The Assumption Business
- President’s Message
- Time Flies…
- Member News
- Thank You to 2025–2026 Society Partners
- Comings and Goings
- Calendar of Events
- Certify Compliance with the CAS Continuing Education Policy
- In Remembrance
- CAS Staff Spotlight
- CAS Advances Technical Leadership and Engagement in Brazil and Argentina
- Across Borders, Across the Profession
- 2026 CAS Trust Scholarship Recipients Announced
- Professional Insight
- Developing News
- On the Shelf: The Zorg
- Finally, Coyote Lawyers Up
- From 10x to 3.2x: What a New Study Reveals About Social Inflation
- Actuarial Science in the Wild: Risk Models in Everyday Life
- Hundreds of Silica Lawsuits and Counting: Is P&C Heading Toward Another Asbestos Crisis?
- Reserve Acceleration with Agentic AI
- Catastrophe Modeling’s Evolution in a Changing World
- Solve This
- Unequal Coolant Tanks

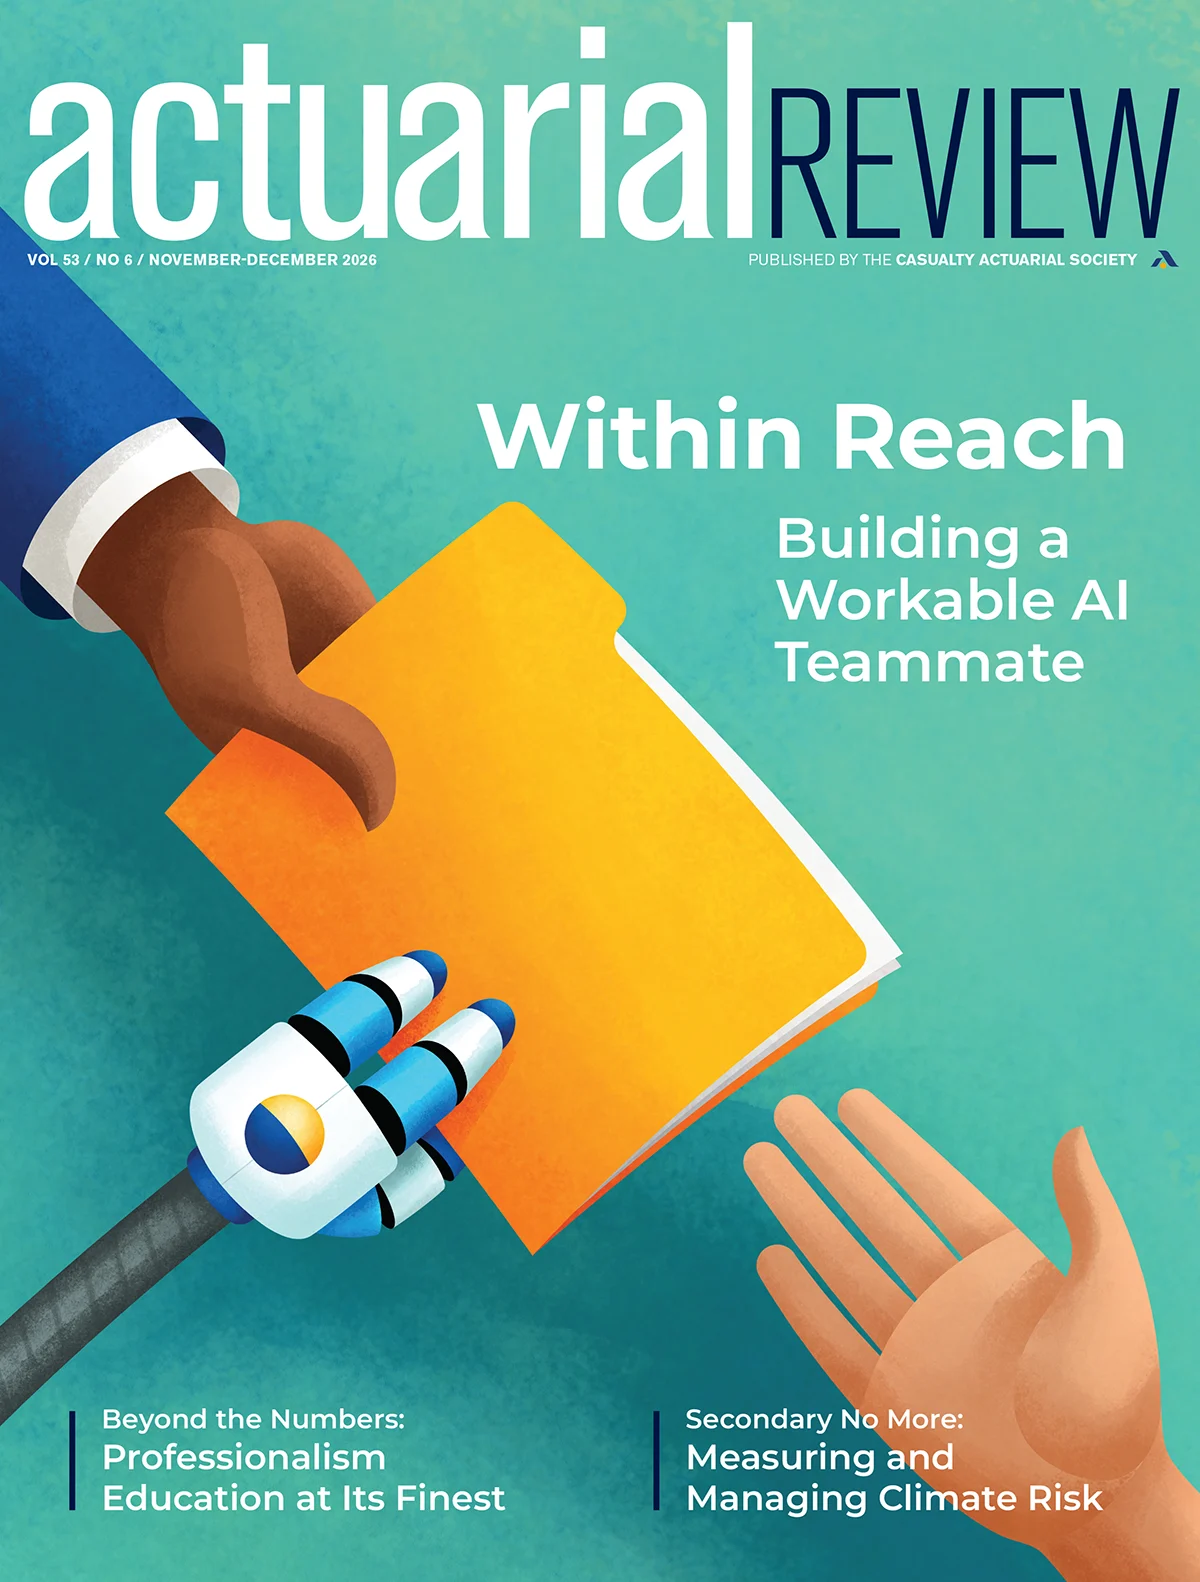
on the cover
-
What does it take to turn generative AI into a trusted actuarial teammate? Our survey reveals where actuaries are putting AI to work, what’s working, and what’s standing in the way.
-
The CAS PEWG earns recognition for helping actuaries navigate ethical gray areas, exercise sound judgment, and uphold professional standards.
-
As so-called secondary perils drive mounting insured losses, actuaries must rethink how climate risks are classified, measured, and managed.
The amount of dues applied toward each subscription of Actuarial Review is $10. Subscriptions to nonmembers are $50 per year. Postmaster: Send address changes to Actuarial Review, 4350 North Fairfax Drive, Suite 250, Arlington, Virginia 22203.



Contents
departments
- EDITOR’S NOTE
- The Assumption Business
- President’s Message
- Time Flies…
- Member News
- Thank You to 2025–2026 Society Partners
- Comings and Goings
- Calendar of Events
- Certify Compliance with the CAS Continuing Education Policy
- In Remembrance
- CAS Staff Spotlight
- CAS Advances Technical Leadership and Engagement in Brazil and Argentina
- Across Borders, Across the Profession
- 2026 CAS Trust Scholarship Recipients Announced
- Professional Insight
- Developing News
- On the Shelf: The Zorg
- Finally, Coyote Lawyers Up
- From 10x to 3.2x: What a New Study Reveals About Social Inflation
- Actuarial Science in the Wild: Risk Models in Everyday Life
- Hundreds of Silica Lawsuits and Counting: Is P&C Heading Toward Another Asbestos Crisis?
- Reserve Acceleration with Agentic AI
- Catastrophe Modeling’s Evolution in a Changing World
- Solve This
- Unequal Coolant Tanks
on the cover
-
What does it take to turn generative AI into a trusted actuarial teammate? Our survey reveals where actuaries are putting AI to work, what’s working, and what’s standing in the way.
-
The CAS PEWG earns recognition for helping actuaries navigate ethical gray areas, exercise sound judgment, and uphold professional standards.
-
As so-called secondary perils drive mounting insured losses, actuaries must rethink how climate risks are classified, measured, and managed.
The amount of dues applied toward each subscription of Actuarial Review is $10. Subscriptions to nonmembers are $50 per year. Postmaster: Send address changes to Actuarial Review, 4350 North Fairfax Drive, Suite 250, Arlington, Virginia 22203.
Masthead

-
Editor in Chief
Jim Weiss
-
CAS Director of Publications and Research
Elizabeth A. Smith
-
AR Managing Editor and CAS Editorial/Production Manager
Sarah Sapp
-
CAS Managing Editor/Contributor
Greg Guthrie
-
CAS Graphic Designer
Sonja Uyenco
-
CAS Cross-Functional Coordinator/Contributor
Delilah Barrow
-
News Editor
Sara Chen
-
Opinions Editor
Richard B. Moncher
-
Editors
- Colleen Arbogast
- Daryl Atkinson
- Karen Ayres
- Glenn Balling
- Robert Blanco*
- Lisa Brown
- Michael Budzisz
- Sumanth Chebrolu
- Nandina Chopra
- Todd Dashoff
- Daniel Jay Falkson*
- Stephanie Groharing
- Julie Hagerstrand
- Srinand N. Hegde*
- Cameron Herrmann*
- Kenneth S. Hsu
- Cindy Hu*
- Jack Huang*
- Rachel Hunter*
- Rob Kahn*
- Benyamin Kosofsky
- Julie Lederer
- Albert Lee
- David Levy
- James Li*
- Sydney McIndoo
- Stuart Montgomery
- Sandra Maria Nawar*
- Erin Olson
- Samiksha Padiyar
- Shama S. Sabade
- Michael Schenk
- Robert Share
- Craig Sloss
- Jared Smollik
- Andrew Somers*
- Bella Thiel*
- Isaac Wash*
- Radost Wenman
- Ian Winograd
- Vanessa Wu*
- Xuan You*
- Yuhan Zhao*
-
*Writing Staff
-
Puzzle
Jon Evans
-
Advertising
Al Rickard, 703-402-9713
arickard@assocvision.com -

The Casualty Actuarial Society is not responsible for statements or opinions expressed in the articles, discussions or letters printed in Actuarial Review. -
For permission to reprint material from Actuarial Review, please write to the editor in chief. Letters to the editor can be sent to AR@casact.org or the CAS Office. To opt out of the print subscription, send a request to AR@casact.org.
Images: Getty Images -
© 2026 Casualty Actuarial Society.
ar.casact.org
The Assumption Business
hat would happen if a century of assumptions were available on demand? Actuaries are finding out one prompt at a time. Our cover story reveals a profession leaning into a future where AI agents function as genuine teammates. But this makes the future more likely to resemble the past than we appreciate. Because LLMs formulate from patterns in training data, agents are born of the assumptions of yesterday.
The review of The Zorg presents a stark example of the consequences of passive compliance with assumptions. The murder of 130 or more enslaved people thrown overboard by the crew of a British slave ship in 1781 became a legal matter that treated the murdered as insured property. Underwriters and jurists debated whether the loss was covered, not whether it should have been allowed in the first place. The case caught the attention of abolitionists, but slavery was not abolished in the U.K. until decades later. While professionals in the courtroom executed their duties within the boundaries they knew, none took ownership of the underlying premise.
The Zorg is a historical failure of unparalleled extremity. This month’s AR explores narrower areas where convention risks complacency in the modern day. We examine how a calm hurricane century and wildfire seasons more severe than modeled inform catastrophe models built on too short a record. We consider whether changing case mix over the past decade is a cause or effect of rising litigation. We compare silica to asbestos and explore whether the industry learned from its last solvency event. Climate change, social inflation, and systemic solvency are broadly agreed upon because evidence dictates that they should be. But even if answers stay the same, we should be able to explain why they are still true.
The challenge with AI is that it has no implicit mechanism to do that. It optimizes to the objective it is given, not the one it should have been given, and is indifferent to what follows. The more it is used, the more it risks training on its own output, whose ingredients were yesterday’s assumptions. Actuaries are in the business of assumptions, and the standards require ownership of them. The ownership does not transfer to a tool such as AI. The greatest risk and opportunity live in the tail, where training data is thinnest. Someone has to go looking.
Actuarial Review
Casualty Actuarial Society
4350 North Fairfax Drive, Suite 250
Arlington, Virginia 22203 USA
Or email us at AR@casact.org

Time Flies…
year ago, I wrote about continuing to implement the CAS Strategic Plan and emphasized three projects I was going to focus on during my term. In no particular order, the three priorities I chose were (1) the CAS brand refresh, (2) updating the CAS website and portal, and (3) addressing challenges in the preliminary exam structure. As I now transition from president to board chair, I am both pleased with the progress we made over the past year and excited to see what the future holds.
Brand refresh
As I commented in a previous message, the refresh was much more than a new visual identity and tagline. It grew from extensive research with members, candidates, employers, students, academics, and other stakeholders to better understand what makes the CAS distinctive, where perceptions of the CAS are strong, and where we have opportunities to tell our story more clearly. That work reinforced the strength of our reputation for P&C expertise while also identifying opportunities to make the broader value of the CAS better understood.
Some of the important aspects of the broader brand refresh initiative include:
- Making the CAS more recognizable beyond our credentials.
- Telling the CAS story earlier to the next generation of actuaries.
- Being more audience- and data-driven in our communication with stakeholders.
With the launch behind us, the work now is making the brand real wherever people experience the CAS. Publications, events and exhibits, social media, presentations, email, web, and other communications are being brought into a more cohesive system of visual identity, voice, and messaging. The goal is not simply consistency for consistency’s sake, but to make every interaction reinforce who the CAS is, what we stand for, and the value our community brings to the world of P&C risk.
Website modernization
- Shaping the redesign by how people use our web assets, rather than how the CAS is organized internally.
- Simplifying and curating the enormous amount of content the CAS has accumulated over time.
- Creating a more unified CAS digital ecosystem.
This work is particularly important in an increasingly AI-driven environment. Our public website is no longer consumed only by people and traditional search engines; its content can also shape the information surfaced by AI systems. Stronger content governance will help ensure that what the CAS puts forward publicly is current, accurate, intentional, and authoritative, while historically valuable material remains appropriately preserved and accessible.
Preliminary examinations
In the meantime, both organizations have been independently evaluating potential changes to preliminary examinations, and even if a common examination at the MAS/SRM level is not the ultimate outcome, we have been exploring together where we can at least align on necessary content for actuarial candidates at this stage. While it falls short of a common exam and does not address candidates’ concerns over which exams to take, this outcome could help simplify the work of university instructors while we continue to look for a more comprehensive solution.
As part of our global growth strategy, we clearly need to attract students to the CAS pathway early on. We will also continue to encounter situations where candidates or members of other organizations desire to pursue a CAS credential but understandably do not wish to start over if they have already completed requirements from other pathways. My hope and expectation is that we will continue to seek solutions that attract aspiring P&C actuaries to the CAS at multiple points along their educational journey, without compromising on CAS standards for educational rigor and practical application of actuarial knowledge. It is also possible, maybe even likely, that advancements in AI will effectively render comparatively minor differences in the earliest stages of actuarial education moot and create opportunities for efficiency in our own examination administration processes that will hopefully enable greater focus on creating effective “on-ramps” to the CAS from alternative pathways across the globe.
Artificial intelligence
Every area within the CAS Executive Council and staff organization has contributed greatly to the future success of the CAS. I greatly appreciate the opportunity to serve as CAS President, and I continue to be amazed at what our capable staff and dedicated volunteers accomplish for the organization and its membership each and every year. And yes, I had fun!
Actuarial Review Letters Policy
Letters shall not contain personal attacks or statements directly or implicitly denigrating the characters of individuals or particular groups; false or unsubstantiated claims; or political rhetoric. Letters should be no more than 250 words and must include the author’s name and phone number or email address, so the editorial staff can confirm the author. Anonymous letters will not be published. There shall be no recurrence of topics; issues previously addressed will not be the subject of continued letters to the editor, unless new and pertinent information is provided. No more than one letter from an individual can appear in every other issue. Letters should address content covered in AR. Content regarding the CAS Board of Directors or individual departmental policies should be directed to the appropriate staff and volunteer groups (e.g., board, working groups, committees, task forces, or councils) instead of AR. No letter that attempts to use AR as a platform for an ulterior purpose will be published. Letters are subject to space limitations and are not guaranteed to be published. The AR editorial volunteer and staff team reserves the right to edit any submitted letter so that it conforms to this policy. Decisions to publish letters and make changes to submissions shall be made at the discretion of the AR Working Group and CAS staff.
For more information on AR editorial policies, visit here.
- Many CAS members and candidates, and university professors mistakenly believe that the CAS and SOA “share” the first two actuarial examinations (Parts 1 and 2 on the CAS syllabus, or P and FM on the SOA syllabus). In reality, the P and FM exams are owned and administered by SOA, and the CAS provides credit for our Exam 1 and 2 requirements to candidates who have completed P and FM, respectively. The CAS receives no revenue from fees associated with these exams and has no control over their development or administration.
Thank You to 2026–2027 Society Partners
Executive Partners




Premier Partners


Supporting Partners

Comings and Goings
Lisa Walsh, FCAS, MAAA, has been appointed head of legacy solutions at ICW Specialty. Walsh will guide the development and execution of legacy solutions, including building a team to support its growth. Walsh brings more than 35 years of insurance industry experience spanning actuarial, underwriting, broking, structured reinsurance, and complex risk transfer solutions.
Yves Charbonneau, FCAS, FCIA, has been appointed chief risk officer at Vantage. Charbonneau brings nearly three decades of actuarial and enterprise risk leadership across the insurance and reinsurance industries. Most recently, he headed the actuarial function at Arch Insurance Company Ltd. in Canada, where he established a portfolio management culture and transformed enterprise data analytics and strategy to deliver profitable growth and strong underwriting discipline.
Ryan Michel, FCAS, MAAA, has been appointed CEO at Grange Insurance Company. Prior to joining Grange, Michel most recently served as president and chief underwriting officer at Trusted Resource Underwriters. He spent over two decades at Allstate Insurance in several significant executive leadership positions, including serving as president of Allstate Business Insurance. Additionally, Michel spent 11 years in Canada as chief risk officer and then president and CEO of the Allstate Canada group of companies.
Robert Blanco, FCAS, MAAA, has been appointed global head of pricing for MS Reinsurance. Robert has more than 40 years of experience, having worked 15 years at NCCI early in his career and for various reinsurance organizations more recently. He will be responsible for all reinsurance treaty pricing and tool development for a team that spans across four offices.
Calendar of Events
-
March 15–17, 2027
Ratemaking, Product and Modeling Seminar
Indianapolis, IN -
May 16–19, 2027
2027 CAS Spring Meeting
Chicago, IL -
June 1–3, 2027
Seminar on Reinsurance
Hamilton, Bermuda


Certify Compliance with the CAS Continuing Education Policy
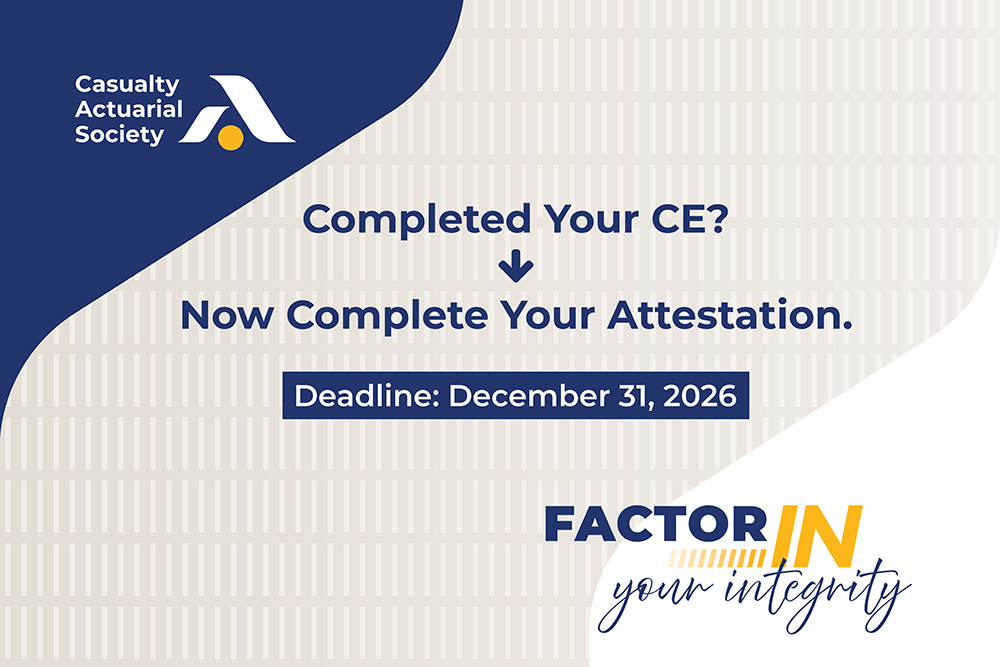
ll Fellows and Associates of the CAS must certify compliance with the CAS Continuing Education (CE) Policy by December 31, 2026, for attestation year 2027 to practice in 2027.
Members certify at the end of each calendar year. Compliance with the CAS CE Policy allows members to provide actuarial services during the following year.
Practicing actuaries should select the attestation year in which they will be eligible to practice after completing the prior year’s CE or continuing professional development (CPD) requirements. For example, a member who completes the required CE/CPD in 2026 may provide actuarial services in 2027.

Members who are not providing actuarial services must still submit an attestation and select “not providing actuarial services.” They are not required to earn CE nor to meet the CAS CE Policy. The policy defines “Actuarial Services” as “Professional Services provided to a Principal by an individual acting in the capacity of an actuary. Such services include the rendering of advice, recommendations, findings, or opinions based upon actuarial considerations.”
Members who neither certify compliance nor indicate that they are not providing actuarial services by January 1, 2027, will appear as non-compliant under the Continuing Education heading in the CAS membership directory. Members listed as non-compliant may be subject to additional administrative penalties determined by the CAS Board.
Should you certify compliance?
The USQS also allows independent study for exams to count toward the CE requirement. Mandatory courses for the ACAS credential, such as the Course on Professionalism (COP), may also count toward CE.
Actuaries in nontraditional roles may still provide “actuarial services” as defined above.
You must attest even if you have not completed the CE/CPD required by your chosen standard. If you attest as noncompliant, you may not provide actuarial services until you meet the applicable requirements. You may update your status to “compliant” at any time after meeting them.
If you recently stopped providing actuarial services, you must attest this year. If you selected “not providing actuarial services” last year and will continue in that status in 2027, you do not need to attest again unless your status changes.
If you provide actuarial services from time to time, you should attest appropriately and meet the CE requirements.
Attestation of “not provided actuarial services” is still needed as a newly retired actuary.
Affiliates are not subject to the CAS CE Policy and do not need to attest.
You recently became a member of the CAS as an ACAS or FCAS and live or work in the United States.
The USQS also allows independent study for exams to count toward the CE requirement. Mandatory courses for the ACAS credential, such as the Course on Professionalism (COP), may also count toward CE.
You are an actuary working in a nontraditional area, such as underwriting, risk management, or executive leadership.
Actuaries in nontraditional roles may still provide “actuarial services” as defined above.
You did not complete the required CE/CPD for your chosen qualification standard or requirement.
You must attest even if you have not completed the CE/CPD required by your chosen standard. If you attest as noncompliant, you may not provide actuarial services until you meet the applicable requirements. You may update your status to “compliant” at any time after meeting them.
You are no longer providing actuarial services.
If you recently stopped providing actuarial services, you must attest this year. If you selected “not providing actuarial services” last year and will continue in that status in 2027, you do not need to attest again unless your status changes.
You are retired.
If you provide actuarial services from time to time, you should attest appropriately and meet the CE requirements.
Attestation of “not provided actuarial services” is still needed as a newly retired actuary.
You are an Affiliate Member of the CAS.
Affiliates are not subject to the CAS CE Policy and do not need to attest.
How to certify compliance
- Go to casact.org.
- Select “Login” and sign in to your CAS member account.
- If you already have a CAS account, select “Current Account Holder Login.”
- If you do not have a CAS account, select “Create an Account.”
- After signing in, go to the “My Account” Homepage.
- Under your name and address, select “My Attestations”.
- Select “Add” at the bottom of the page.
- Confirm that the attestation year is “2027.”
- Under “Attestation Compliance,” select the statement that applies to you.
- Under “Attestation Method,” select the Recognized National Standard you are following.
For more information, visit these CE webpages:
- Continuing Education Policy
- New ACAS Members – Attestation & CE Requirements
- United States Qualification Standards Overview
- Continuing Education FAQs
Questions? Email ce-review@casact.org.
In Remembrance
A Sportsman and Devoted Family Man
1952-2026
John Jeffrey Limpert of Bald Head Island, North Carolina, passed away in February 2026. Limpert was the son of the late John V. Limpert (Jack) and Anne Thornton Lowry. After the Jack’s tragic death when John was a toddler, Anne remarried Malcolm Lowry and John became an integral part of their family. John graduated from Kenyon College in 1974 and earned his MBA from Carnegie Mellon University in 1976. He began his career as an actuary with Royal Insurance (now RSA insurance group) in New York City. In 1978, John was sent for two years to work at the company’s headquarters in Liverpool, England. He eventually advanced to chief actuary with Royal. Thanks to the fortuitous relocation of Royal to Charlotte, John met Karen. The two were wed in June1995 and enjoyed 31 years together. John was a devoted husband, father, brother, and friend. Spending time with family was special to him. He loved sports and especially European soccer. John spent the last 10 years with Karen at their home on Bald Head Island, where they enjoyed some of the most precious moments of their lives together. He is survived by his wife, Karen Limpert; three children, Alex Sanders and his wife, Kelly, Ben Sanders, and Alina Limpert; three grandchildren, Landon, Libby, and Bella Sanders; and three brothers, Brad Lowry, Andy Lowry and his wife, Delores, and Doug Lowry and his wife, Nancy.
The Traveling Music Man
1962-2026
Jeffrey “Jeff” Robert Jordan of Boulder City, Nevada, passed away in July 2026. Jordan lived a life marked by unwavering faith, deep love for his family, and quiet generosity. Although his final home was Boulder City, he lived in Iowa, Missouri, Illinois, Georgia, Massachusetts, and California. Jordan graduated as valedictorian from Lincoln High School in 1980 before earning a bachelor of science in business administration with a concentration in actuarial science from Drake University in 1984. By the age of 25, he had passed all the actuarial examinations, becoming the youngest person to become an FCAS at the time. He enjoyed a distinguished 40-year career as a P&C insurance actuary. After serving as a partner at Ernst & Young, Jordan founded Jordan Actuarial Services in 2003, building a highly successful consulting practice. Jordan loved to travel with his wife and children. Before ALS ended his travels, Jordan visited 23 of the 30 Major League stadiums, 51 of the nation’s 63 national parks, 48 of the 50 states, and numerous countries around the world. Music was another of Jeff’s greatest passions. Anyone who knew Jeff will remember him for his dry, quick wit and his strong Christian faith. Jordan is survived by his wife; children, Amanda Billy, Mitchell (Brittney) Billy, Drew (Megan) Jordan, and Nicole (Russell) Baad; grandchildren, Bristol Billy, Arthur, Calvin Jeffrey, Violet Baade, and Tessmer Robert Jordan; and sister, Debra Jordan. He was preceded in death by his parents, Donald Jordan and Janice (Smith) Jordan.
The “Rebel” Actuary
1968-2026
Christopher John Burkhalter passed away in August 2026. He was the son of Vol Burkhalter and Paula Burkhalter, née Steckel. On November 4, 2006, he married his wife, Alexis Burkhalter. They had two children, Jake and Nathan Burkhalter. Burkhalter poured himself into the life of his family. He was a highly regarded and successful actuary. Starting with a single client in 1999, he built a thriving consulting practice by combining his gifts with dedication and reliability. He was known for his ability to communicate complex ideas and earned a wide professional reputation for his unmatched combination of deep technical knowledge and interpersonal skills. Alongside his professional success and remarkable intellect, he was also known for his humility and good humor. He had a gift for making friends wherever he went, with friendships that crossed every imaginable boundary of age, position, and background. He found the good in people and always brought out the best in those around him. Burkhalter cheered on the Ole Miss Rebels more than anyone. He loved Rebel football and baseball and especially enjoyed sharing that love with his family and friends. He held positions of leadership in his churches over the years and willingly used his gifts to serve others. He had a deep understanding of scripture and sought to lead others in the Christian faith. He is survived by his wife, Alexis; his children, Jake and Nathan; his brothers, James (Judy) Burkhalter and Mark (Molly) Burkhalter; and his sister, Linda (Gary) Stringer. He is also survived by many other beloved family members and close friends. He was preceded in death by his parents and his grandmother, Hildegard Anders.
The Professor and Hobbyist
1942-2026
Janice Rose Zemanek Cutler passed away in February 2026, in Palatine, Illinois. She was born in Chicago, Illinois, to Ludwig and Mary Zemanek. Her family later moved to a dairy farm in Deerbrook, a small town in central Wisconsin. She and her siblings attended the one-room Little Chicago Grade School. She excelled in all subjects, showing a particular aptitude in mathematics. She earned a full scholarship to the University of Wisconsin-Madison and graduated in 1964 with a B.S. in math. She received her doctoral degree from the University of Illinois Urbana-Champaign. Zemanek served as an assistant professor of mathematics at Louisiana State University from 1970 to 1976. It was at LSU that she met her husband of 52 years, William “Bill” Cutler. Janice applied her math expertise to the insurance industry, beginning a successful career in 1978 as an actuarial assistant for Wausau Insurance. In 1985, she and Bill moved to Palatine, Illinois, where she worked at Zurich Insurance in Schaumburg through 1999 and then as an actuarial consultant for John Pierce from 1999 to 2008. Ultimately, Janice returned to the classroom as an adjunct professor from 2005 to 2020 in the mathematics department at Harper Community College. She traveled to England, the Czech Republic, Japan, Australia, Finland, Brussels, France, Germany, and Luxembourg to attend puzzle parties with her husband. Janice enjoyed a variety of crafting hobbies and was an avid reader. She is survived by her husband, Bill; her daughters, Barb Cutler (Derek Bruening) and Beth (Stefan) Lowe; and her cherished grandsons, Felix Lowe and Tristan Lowe. She is also survived by her twin sister, Janet Dixon; her brother, Kenneth (Ann) Zemanek; and her sister, Ellen (Robert) Christenson.

CAS Staff Spotlight
Meet Yuserah Nasseri, HR Generalist

Yuserah Nasseri
elcome to the CAS Staff Spotlight, a column featuring members of the CAS staff. For this spotlight, we are proud to introduce you to Yuserah Nasseri.
- What do you do at the CAS? How does your role support the Strategic Plan?
As a human resources (HR) generalist here at the CAS, I support a variety of HR functions, including benefits, HRIS administration, talent acquisition, and day-to-day employee support. My role is ultimately about helping create a positive and effective employee experience so that our people have the resources and support they need to do their best work. - What inspires you in your job? What do you most love about your job?
What inspires me most is knowing that HR has an impact on people at every stage of their employee journey. I enjoy being able to solve problems and make someone’s experience at work a little easier. I also love that I get to work with so many different people and learn something new every day.

- Describe your educational and professional background. What do you bring to the organization?
I graduated from George Mason University with a bachelor’s degree in public health and concentration in clinical science in 2017. However, my professional background has been centered around human resources, workforce strategy, and employee support. Before joining the CAS, I worked in HR roles where I gained experience in workforce analytics, HR operations, recruiting, employee relations, reporting, and workforce planning. I’ve also had the pleasure of working in both the private and public sector, which has given me a broad perspective on HR. I bring a combination of problem solving, collaboration, and a genuine passion for helping people. And I am always looking for ways to keep the employee experience at the center of our work here at the CAS. - What is your favorite hobby outside of work?
Outside of work, I love staying active. I enjoy working out, playing soccer, and generally finding ways to stay active and have fun. I also really enjoy spending time with family and friends. - If you could visit any place in the world, where would you go and why?
Japan! I’ve always wanted to experience the culture, scenery, and food firsthand. Getting to enjoy sushi in Japan would be a highlight of my journey since I’m a huge sushi lover. - What would your colleagues find surprising about you?
My colleagues might be surprised to learn that I’m pretty competitive! I love sports and fitness, and I enjoy a good challenge, especially when told I can’t do something.
CAS Advances Technical Leadership and Engagement in Brazil and Argentina
he CAS Latin America Regional Working Group (LARWG) recently deepened its engagement across the region through major events in Brazil and Argentina, delivering high-impact technical programming in collaboration with local actuarial associations.
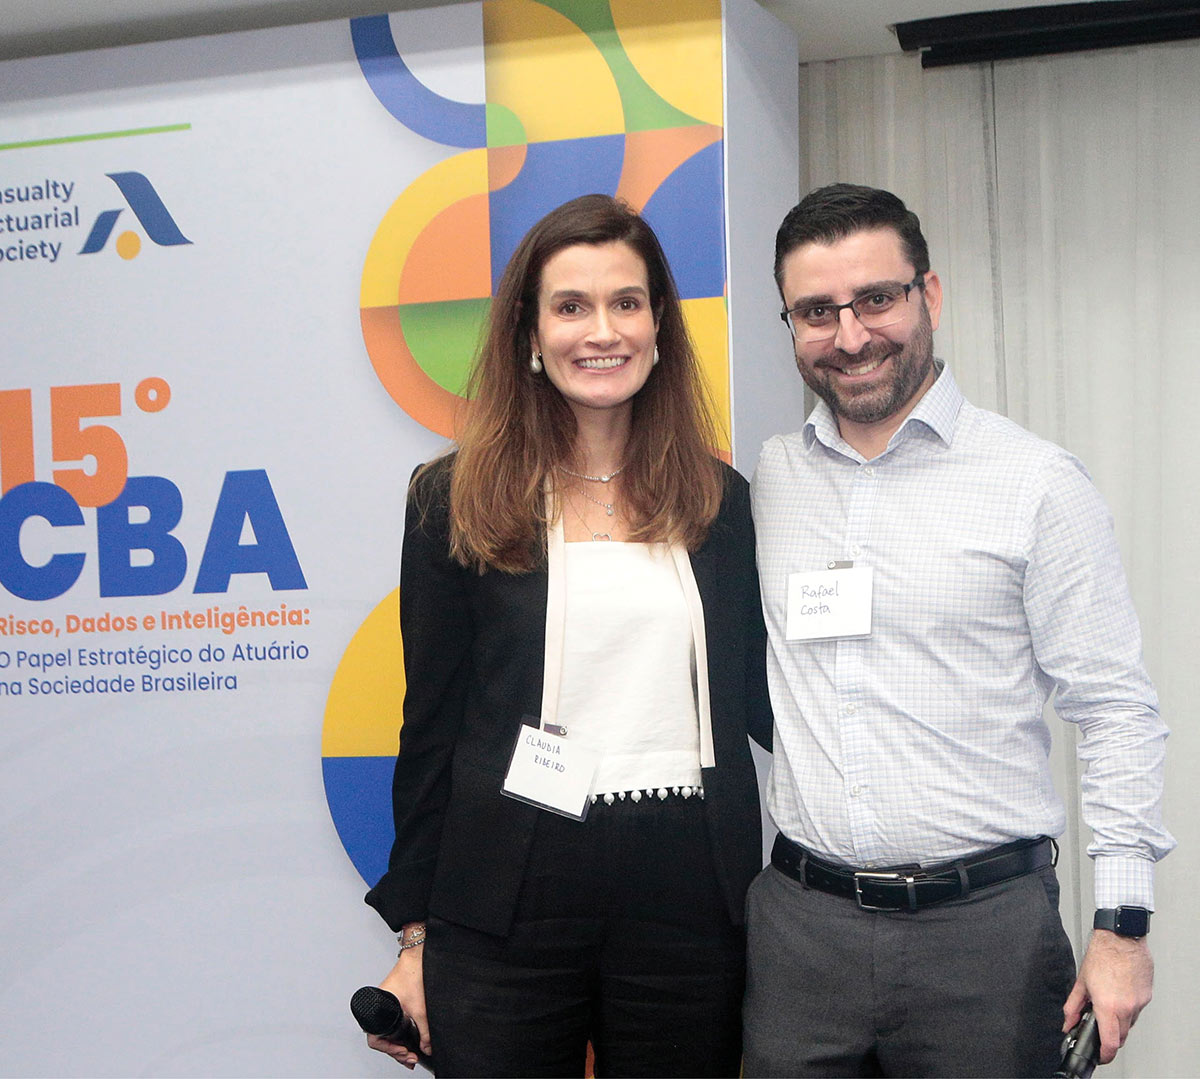
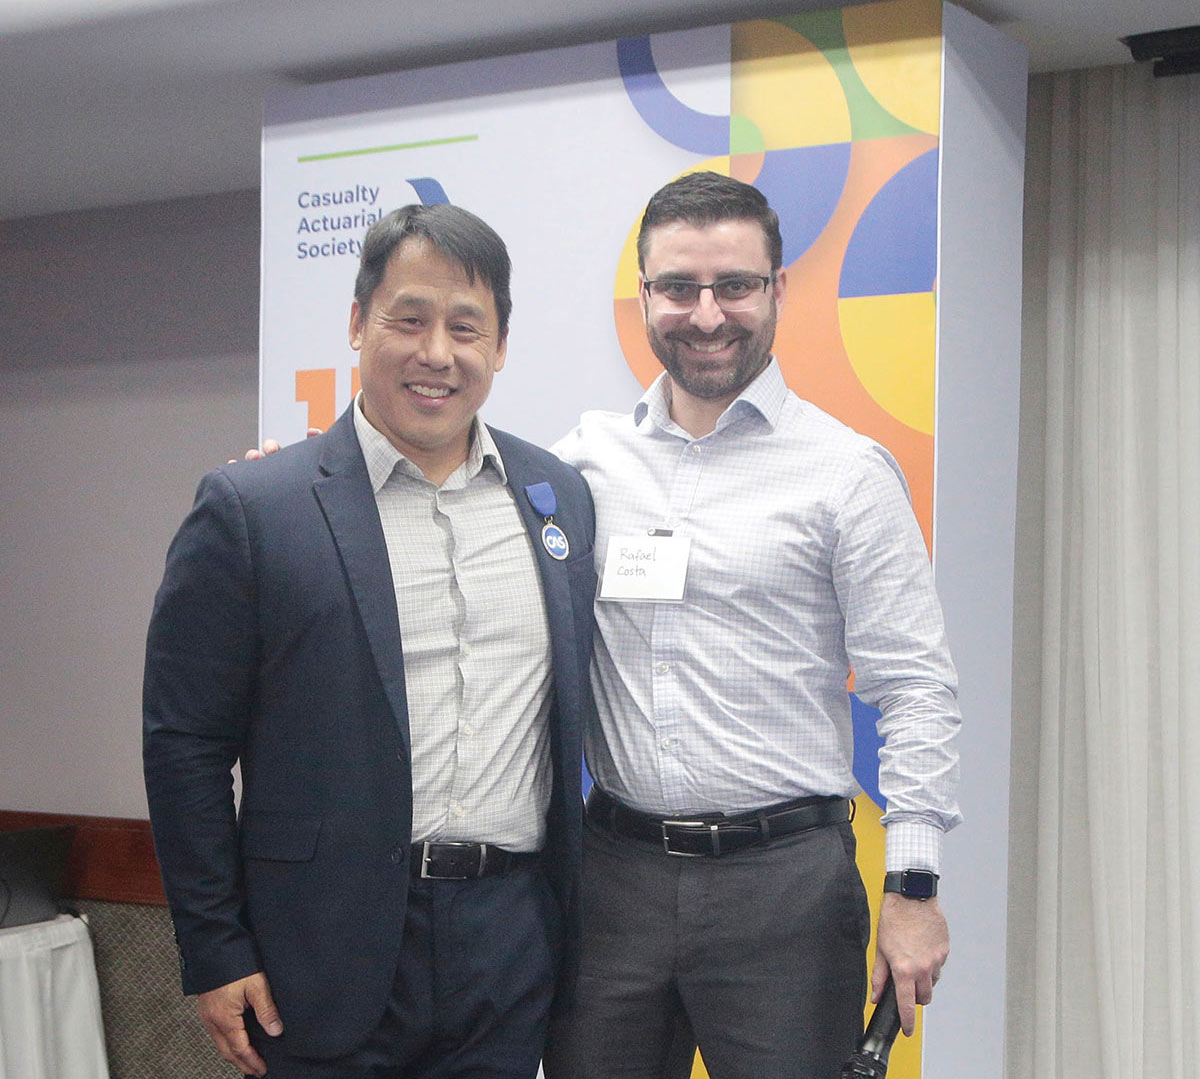
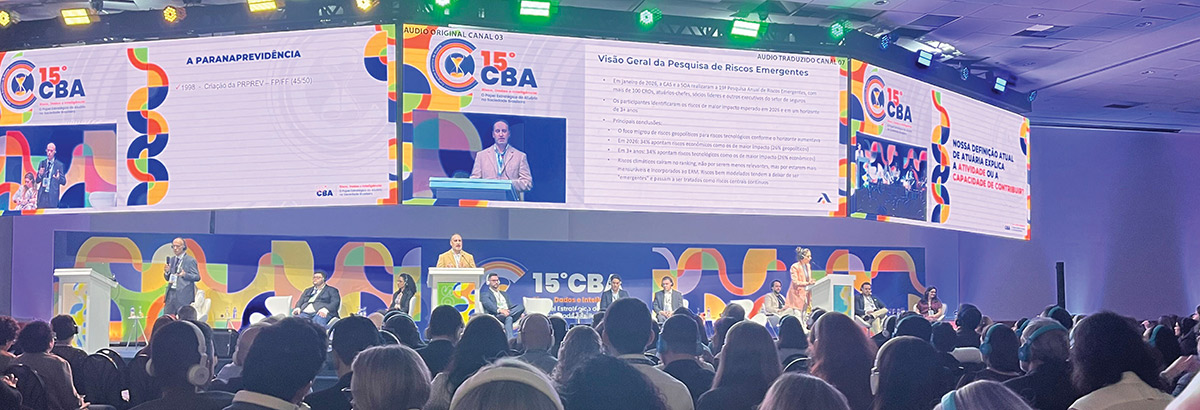
In Rio de Janeiro, Brazil, the CAS served as a Gold Sponsor of the sold-out 15th Brazilian Actuarial Congress, attended by over 650 attendees, and hosted by the Brazilian Institute of Actuaries (IBA). CAS Vice President, International Keith Berman presented about emerging risks. The CAS also held a dedicated four-hour technical seminar for over 50 professionals and students, exploring cutting-edge topics including AI developments, legal system abuse, carbon-credit asset allocation, and reinsurance credit risk.
In Buenos Aires, Argentina, the CAS sponsored the Argentine Society of Actuaries’ (SAAC) sold-out Actuar.IA seminar, drawing over 250 participants. The CAS hosted an interactive pricing workshop where attendees leveraged AI agents to manage portfolios in simulated markets. CAS speakers also contributed to panels discussing regulatory frameworks for AI and regional professional pathways.
These joint initiatives demonstrate the CAS’s commitment to advancing P&C actuarial science and building lasting partnerships with IBA and SAAC. We extend our sincere thanks to Claudia Novello Ribeiro (CAS Affiliate Member, Representative for Brazil), Juan Ignacio de Oyarbide (CAS Affiliate Member, Representative for Argentina), Keith Berman, FCAS (Vice President – International), and Frank Chang, FCAS (former CAS President), for their invaluable support in making these events a success and furthering CAS engagement across Latin America.
Across Borders, Across the Profession
he CAS is committed to meaningful global engagement, collaboration, and knowledge sharing across the worldwide actuarial community. Through partnerships with actuarial organizations throughout Asia, CAS members and speakers have contributed their expertise to conversations addressing some of the most important issues shaping the future of the profession.
From artificial intelligence and automation to autonomous vehicles, sophisticated pricing techniques, professionalism, and financial reporting, CAS speakers brought P&C expertise to insurance and actuarial professionals from across the region’s diverse countries.
Three recent events demonstrated the strength of this collaboration: the ASM-CAS-IAAust Joint Seminar in Kuala Lumpur, the Asian Actuarial Conference 2026, and the 2026 AICT/CAS Joint Property Casualty and Health Actuarial Seminar in Taipei.
Exploring the actuary of tomorrow in Malaysia
Ron Kozlowski opened the event on behalf of CAS and delivered the keynote address, “What’s Next? Flying Cars?” He also joined Aw Yong Chor Leong of Swiss Re for “Special Circumstances in Professionalism: What Would You Do?” that explored the role of professional judgment in increasingly complex situations.
CAS speakers also contributed to conversations about leadership and the insurance workforce. Gary Hoo, CEO of AIA General Berhad, participated in the “Actuary to CEO” panel, while Tiffany Tan Shi En of MSIG Insurance Malaysia and Nurul Syuhada Nurazmi of Actuarial Partners Consulting joined the “Women in Insurance Industry” panel.
Together, the sessions highlighted the range of technical, professional, and leadership skills needed as actuaries prepare for the future.
Redefining risk at the Asian Actuarial Conference
Technology emerged as a central focus. CAS President Barry Franklin presented “Professionalism in a Dynamic Environment: The Challenge of AI,” addressing the professional considerations accompanying the growing use of artificial intelligence in actuarial work.
Tan Wei Chyin of Income Insurance Ltd demonstrated opportunities to streamline actuarial processes in “Power Automate for Actuaries: From Manual Processes to Automated Workflows.”
Emerging technologies were also at the center of Ivy Liang Xuan of Grab’s presentation, “A Bayesian Hybrid Pricing Framework for Autonomous Private Hire Vehicle Fleets: Integrating ADAS Proxies with Dynamic Disengagement Rates,” which explored how advanced pricing approaches can respond to new mobility risks.
CAS Board Member Shaun Wang presented “Resilient City Development: Risk Prevention and Financial Empowerment,” expanding the conversation to the role risk professionals can play in strengthening communities. Mehul Dave and Jing Yean Wong of WTW also co-presented “UW / Portfolio Management Sophistication,” which focused on continued advancement in underwriting and portfolio management.
Across these sessions, speakers demonstrated how actuaries are expanding their tools and perspectives to address an increasingly complex risk landscape.
Continuing collaboration in Taipei
Co-organized by the Actuarial Institute of Chinese Taipei (AICT) and the CAS, the annual seminar brought international P&C actuarial perspectives together with the needs and experiences of the local market. This year’s seminar highlighted a particularly strong CAS presence, with all featured speakers representing the CAS.
The 2026 program focused on several topics at the forefront of the insurance industry, including artificial intelligence, electric vehicles, and IFRS 17. Presentations emphasized practical insights and actionable approaches relevant to domestic market conditions, connecting broader global developments with challenges actuaries encounter in their day-to-day work.
Looking ahead
These events also demonstrated the value of collaboration across borders. Bringing together actuarial organizations and professionals from different markets creates opportunities to exchange ideas, learn from different experiences, and develop stronger approaches to shared challenges.
As the CAS starts to look ahead to 2027, the conversations and connections built throughout 2026 provide a strong foundation for continued international collaboration. Through partnerships, shared expertise, and an ongoing commitment to learning, the CAS looks forward to continuing to engage with actuarial communities around the world and helping shape the future of the profession.

2026 CAS Trust Scholarship Recipients Announced
he CAS is proud to recognize ten outstanding students as recipients of the 2026 CAS Trust Scholarship. The CAS Trust Scholarship supports the next generation of P&C actuaries, recognizing students who demonstrate exceptional academic achievement, professional promise, and a commitment to pursuing the CAS pathway. Through specialized education grounded in real-world insurance decision-making, the CAS prepares future actuaries to build expertise in the areas at the heart of P&C risk and become leaders in the profession.
Selected from a competitive pool of highly qualified applicants from around the world, the 2026 awardees are Beatrice Antoinette, Luckson Chigarire, Lucas Collins, Xuan Gu, Muhammad Rayyan Habib, Givemore Makusha, Madison Nesterick, Sam Ng, William Xie, and Rainie Yang. The CAS congratulates each recipient on this achievement.
$5,000 CAS Trust Scholarship Recipients
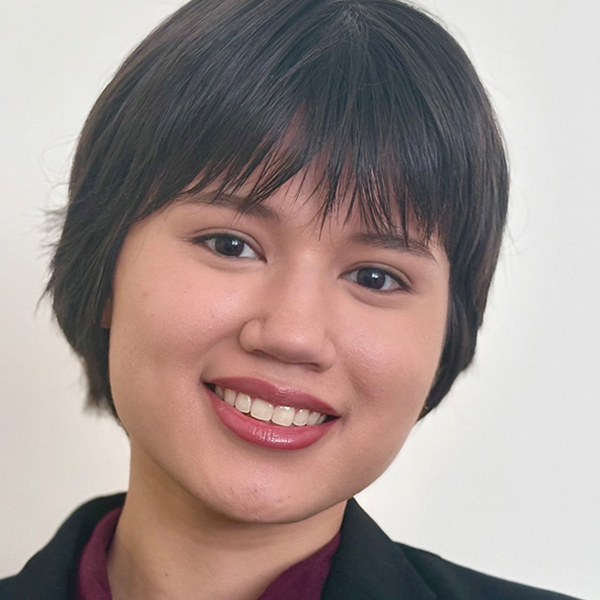
Beatrice Antoinette
“I am deeply humbled to be recognized as a CAS Trust Scholarship Recipient. Thank you to the CAS Trust Scholarship Committee for believing in my potential as a future actuary and for your financial and professional support. This award motivates me to give back to the actuarial community and be a resource for students just beginning their journey, the way others have been for me.”
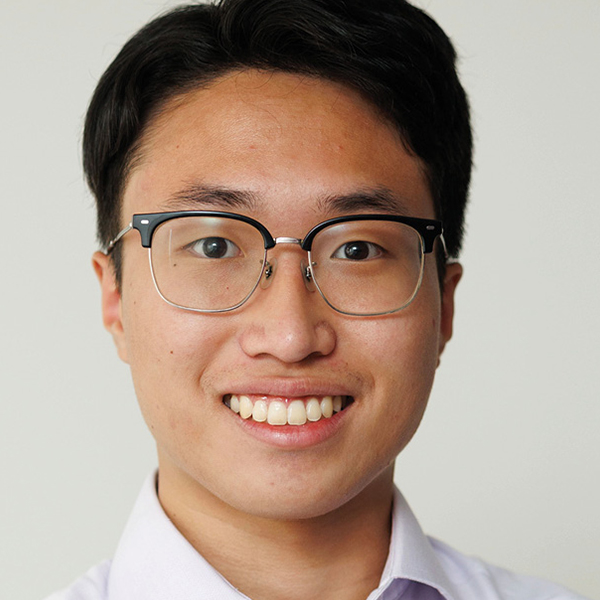
Sam Ng
“I’m honored to receive the CAS Trust Scholarship. Everyone I’ve met in the actuarial profession has been nothing short of smart, ambitious, and supportive. Thank you to my family, professors, mentors, and friends for your unwavering support.”
$2,500 CAS Trust Scholarship Recipients
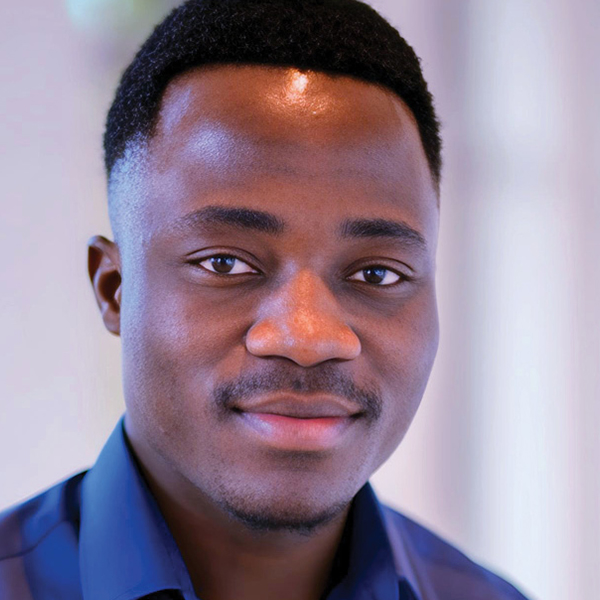
Luckson Chigarire
“I am deeply honored to receive this recognition from the CAS Trust Scholarship Committee. This scholarship is a reflection of the mentors, peers, and committees that have invested in my journey, and it motivates me to continue pushing the boundaries of what I can contribute to the actuarial profession.”

Lucas Collins
“Being selected for the CAS Trust Scholarship is an honor. The actuarial community has shaped so much of my journey so far, and knowing I have this support inspires me to keep pushing with passion and dedication as I work toward my goals.”
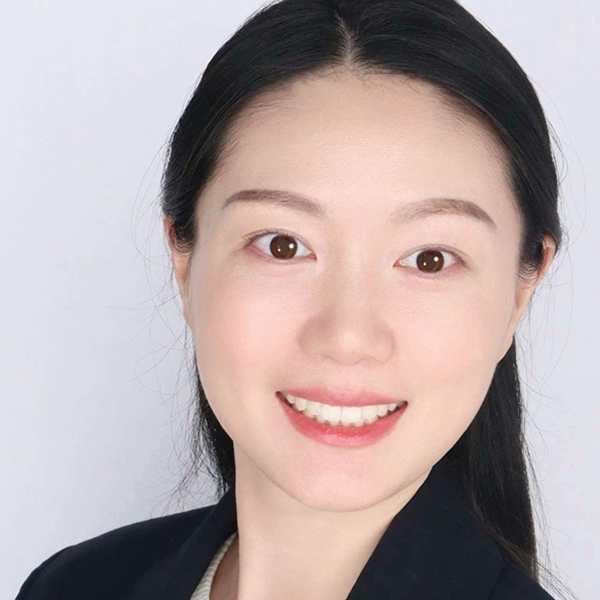
Xuan Gu
“I am incredibly grateful to be recognized as a recipient of the CAS Trust Scholarship. The support and opportunities provided by the CAS — including case studies, student programs, and industry events — have played an important role in my actuarial journey. I look forward to continuing my growth in the profession and giving back to the actuarial community in the future.”
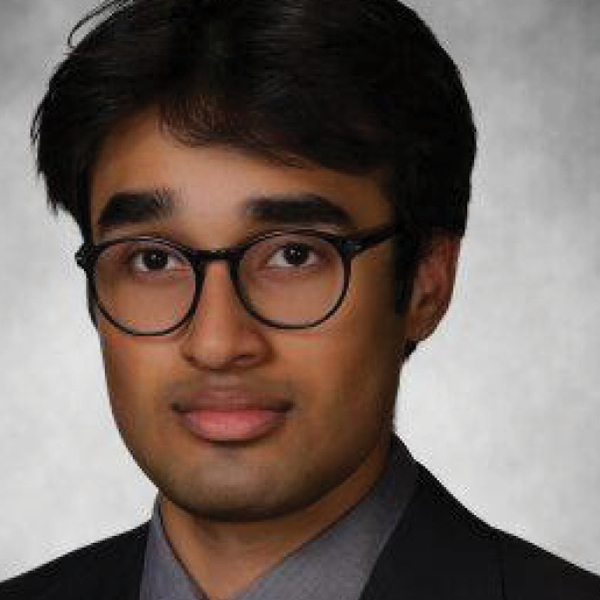
Muhammad Rayyan Habib
“I am extremely grateful and honored to receive this scholarship. As an international student, it will significantly help alleviate financial burdens while allowing me to focus on advancing my career as a future actuary. This support will enable me to further develop my technical skills, gain valuable hands-on experience, expand my professional network, and continue progressing through the actuarial exam process.”
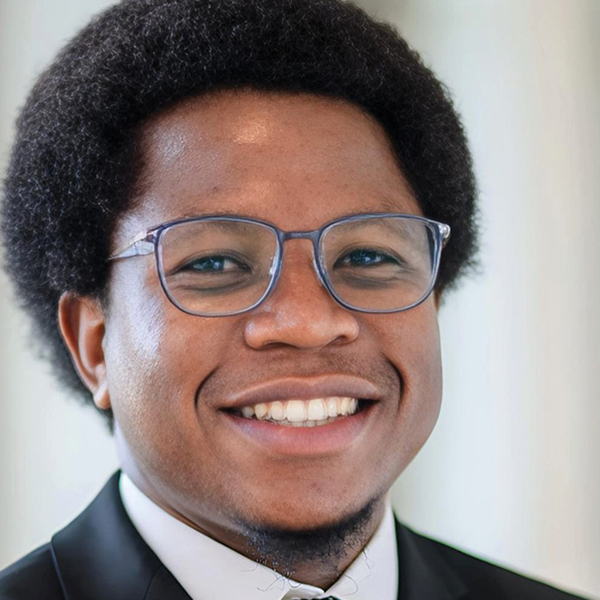
Givemore Makusha
“Receiving this scholarship is a profound reminder that the path I have chosen is worth every challenge. I am deeply grateful for the recognition and committed to giving back to the actuarial community that has invested in me.”
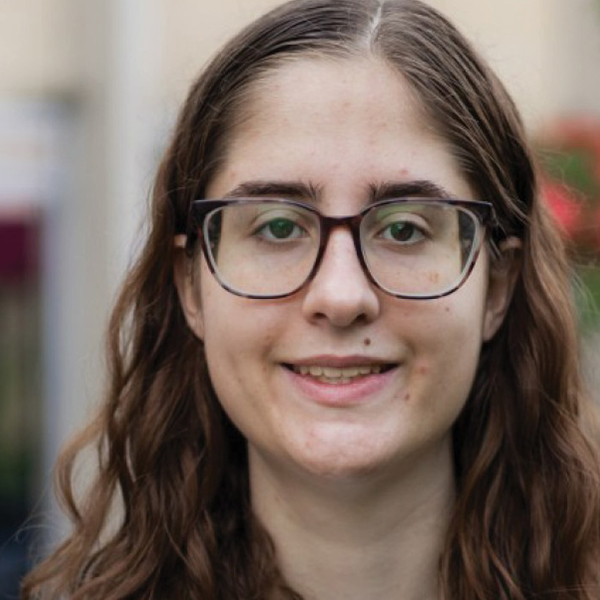
Madison Nesterick
“I am honored to receive this scholarship from the CAS and am extremely grateful to those who have supported me on my journey. This recognition encourages and allows me to continue pursuing actuarial science.”

William Xie
“I am truly honored to have received this award from the CAS and want to thank my friends and family for all the support and encouragement they’ve provided along the way. Hopefully this recognition can help further inspire many aspiring actuaries who are also looking to make a positive impact in the field as well.”

Rainie Yang
“I am honored to receive this recognition from the CAS and grateful for the support of my mentors, professors, family, and friends along the way. This recognition motivates me to continue pursuing excellence in the profession while giving back to the actuarial community that has played such an important role in my journey.”
The CAS Trust Scholarship Program is funded by donations to the CAS Trust, which affords members and others an income tax deduction for contributions of funds used for scholarships and research grants. The CAS Trust was qualified by the Internal Revenue Service in 1979 as a nonprofit organization exempt from federal income tax under section 501(c)(3) of the Internal Revenue Code.
CAS members are invited to contribute to the Trust; inquiries and contributions should be addressed to the CAS’s Chief Business Officer, Joyce Warner, at JWarner@casact.org.
The CAS AI Primer
- Provide a concise overview of AI concepts and applications relevant to actuarial work.
- Highlight potential risks and outline best practices for responsible AI use.
- Outline key corporate and regulatory considerations that shape AI implementation in actuarial contexts.
- Direct readers to trusted learning resources for building deeper AI literacy and practical skills.
Beyond the Numbers:
Professionalism Education at
Its Finest
ou are reviewing the results of a model used to support an important business decision. The analysis is technically sound, but something about the result does not sit right. Maybe the data have limitations that are not immediately apparent. Maybe an AI-enabled tool played a role in producing the analysis, and the documentation isn’t clear. Or perhaps someone with a stake in the outcome is pushing you toward a particular conclusion.
There may not be a rule that tells you exactly what to do next.
Should you rely on the result? What needs to be disclosed? When is additional validation necessary? What happens if another actuary sees the situation differently? And what if questioning the result puts you at odds with an employer or client?
Melissa Huenefeldt
Actuaries have the Code of Professional Conduct and Actuarial Standards of Practice (ASOPs) to guide them, but those standards cannot anticipate every situation an actuary will encounter. Technical education can help actuaries build the skills to perform an analysis. Professionalism education governs whether the actuary should be the one doing the analysis, important considerations as part of the analysis, and what communication obligations follow from sharing the results.
“I see professionalism as a thread that runs through everything we do in professional education,” said Vice President, Professional Education and former PEWG Chair, Melissa Huenefeldt. “We can give actuaries opportunities to build their technical skills and learn about emerging issues, but they also need to know how to apply that knowledge in the real world.”
That need is becoming more important as actuarial work changes.
Huenefeldt points to questions surrounding data quality, transparency, bias, reliance on models, and AI-generated work, among others. Professional standards provide a foundation, but actuaries will increasingly encounter situations that are not specifically addressed by an ASOP or the Code of Professional Conduct.
“The tools will change,” Huenefeldt said. “Our responsibility for the work won’t.”
Making professionalism practical
That distinction shapes the group’s approach to both continuing education and the CAS Course on Professionalism (CoP).

Zach Suter
One example is “Are You Qualified?” — an interactive presentation based on an idea developed by Ron Kozlowski in Asia and adapted to U.S. Qualification Standards. Rather than simply presenting those standards, the session asks participants to work through career and job-transition scenarios and to consider whether they would be qualified to do the work inherent in those transitions.
There is room for disagreement — intentionally.
“The scenarios are open to interpretation,” Suter said, noting that the resulting conversations can surface perspectives even the facilitator had not considered. Feedback from participants is then incorporated into future versions of the program, creating what Suter described as a continuous cycle of development and improvement.
That emphasis on discussion is especially evident in the Course on Professionalism, often one of a new CAS candidate’s earliest experiences with the Society.
Volunteer Co-Vice-Chair Sydney McIndoo said candidates regularly tell her they did not expect a professionalism course to be so interactive or enjoyable.
“Our group works hard to make sure that the presentations, topics, and case studies are thought provoking, engaging, and current with scenarios actuaries face in their work today,” McIndoo said.
This year, that included bringing artificial intelligence into the conversation. The PEWG added a “snapper,” or mini case study, to the Course on Professionalism that asks candidates to begin considering how AI interacts with ASOPs and the Code of Professional Conduct.
For McIndoo, the goal is not necessarily to give candidates a definitive answer to every question AI may create. It is to begin building the habits necessary to think through them.
“By incorporating this topic into the CoP, we are helping lay the foundation for the continued discussion and thoughtful consideration of AI within the actuarial profession,” she said.
Education that evolves with the profession
“We’re going to encounter situations that aren’t specifically addressed in an ASOP or the Code of Professional Conduct, and actuaries need to be comfortable exercising professional judgement as they navigate those situations,” Huenefeldt said.
Sydney McIndoo
The group’s work also extends well beyond courses and meeting sessions. Its subcommittees develop continuing education, administer and improve the CoP, expand professionalism education internationally, and review exposure drafts of ASOPs. Volunteers contribute comments on proposed actuarial standards and develop new resources for the profession.
Among those resources is a new professionalism monograph authored by Volunteer Co-Vice-Chair Josh Taub.
Taub has been part of PEWG since 2015, although professionalism education was not originally what drew him to the group. After beginning to work fully remotely, he was looking for more opportunities to interact with other actuaries. Instead, he discovered a subject that fascinated him.
Josh Taub
His monograph became a substantial undertaking involving input from numerous experts and an extended period of development and refinement. Suter remembers Taub being so excited about the original idea that he insisted Suter call him while Suter was on PTO so he could explain it.
Later this year, the finished work is expected to become part of the CAS Monograph series. Taub believes even experienced actuaries will find something new in it.
“I certainly learned a lot putting it together,” he said.
A working group that practices what it teaches
They are practicing actuaries from different roles, subject areas, and career stages. They bring the professional questions they encounter in their own working lives into a group where those questions can be considered from multiple perspectives.
“Professionalism education isn’t just about telling members what the standards say,” Huenefeldt said. “It’s helping them think about what those standards look like when you actually have to apply them.”
McIndoo has experienced that firsthand. Working with a relatively small circle of actuaries for much of her career, she originally joined PEWG in part to build connections and learn from others. She now describes the group as a network she can turn to as a sounding board and says the experience has highlighted “how professionalism touches nearly every aspect of my work as an actuary.”
The volunteers also seem determined to prove that professionalism does not have to be dry.
Taub describes the group’s culture as “very positive and sometimes playful,” including group dinners during the Course on Professionalism and, according to Taub, rumors of karaoke afterward.
That camaraderie carries into the work. McIndoo sees members readily volunteering, contributing ideas and remaining active in discussions. Suter points to the unusually long tenure of many volunteers as another indication of their commitment. Members stay because they believe in the mission, but they also continue contributing rather than simply occupying a seat.
The results are evident in the response from CAS members. Taub said professionalism sessions developed by PEWG tend to be among the highest-rated sessions at CAS meetings.
“Hopefully we are giving them a good welcome to the profession and the CAS,” Taub said.
But perhaps the group’s greatest contribution is creating a place where actuaries can wrestle with questions for which an appropriate response may depend on context, judgment, and perspective.
“Many of the topics we discuss are not always black and white,” McIndoo said. PEWG, she added, creates an environment where actuaries can have “healthy, thoughtful conversations surrounding different perspectives.”
The PEWG is helping actuaries prepare for problems that cannot be solved by technical expertise alone. Its volunteers are creating education that asks actuaries to question, discuss, listen, and exercise judgment — whether the issue involves qualification standards, an ASOP, pressure from a stakeholder, or a technology that did not exist when today’s professional standards were written.
The group cannot tell an actuary exactly what to do in every situation. But it can prepare actuaries to make that decision when the moment comes.
Secondary No More:
Measuring and
Managing Climate
Risk
n September 2, 2026, Toronto, Canada endured what city officials called a “1-in-100-year storm,” and in the span of a few hours that afternoon, parts of the region received more than 110 millimetres of rain. Hail the size of golf balls fell across the city at the same time. The storm also cut power to around 65,000 residents while flooding the Don Valley Parkway which is a major artery into the heart of Toronto, and inflicted significant structural damage to countless buildings across the city as officials issued tornado warnings and emergency crews scrambled to respond to the fallout.
It wasn’t Toronto’s first brush with climate-related events that summer. Several weeks earlier, wildfire smoke drifting south from Ontario’s worst fire season on record gave the city the worst air quality of any major city in the world that day, before continuing south across the border into the U.S.
If we widen the lens, the pattern holds. In the U.S., at the time of writing, the first half of 2026 alone produced 12 separate billion-dollar weather disasters, eight of them severe storms, together causing at least $31.9 billion in damages.1 That follows on the heels of the 2025 Los Angeles wildfires, which produced roughly $40 billion in insured losses.2 Outside North America, a similar trend emerges. According to the Swiss Re Institute, insured losses from severe convective storms are rising about 10% a year in Europe and flood losses about 12% a year in Asia,3 while in Australia, a single 2025 hailstorm in Brisbane cost insurers $1.8 billion.4
Even though these events have caused significant losses, the insurance industry still labels many of them ‘secondary.’ Primary perils consist of tropical cyclones and earthquakes while nearly everything else including severe convective storms, floods, wildfires, and drought is considered secondary. According to the Swiss Re Institute, in 2025, so-called secondary perils accounted for a record 92% of global insured natural catastrophe losses,2 up from 59% in 2024.4 None of this may be news to Actuarial Review readers. Writing in these pages in July 2025, Dale Porfilio puts it plainly, “I concur with the misnomer of secondary perils. They may be secondary in the eyes of catastrophe models, but they certainly cannot be for property owners and insurers.”5 He was right, and the data since then have only sharpened the point. But the question posed remains unanswered. If “secondary” is wrong, what should we call it?
“Non-peak perils” is an alternative we’ve been hearing more often these days. It’s a step up, yet it still sounds unserious, similar to the “secondary perils” name, especially considering the impact these perils have caused so far and are expected to cause as we move forward.
A better option is climate perils. It sounds more serious, unambiguous, and relatable, and it lines up with how climate change actually shows up in the data, not as a new peril in its own right, but as existing perils worsening in frequency, intensity, and geographic reach, according to experts in the field.6 Drought, wildfire, and heavy-rainfall flooding are worsening, and hail may be too. Earthquakes are an exception, since a warming planet does not seem to make them more frequent.
The obvious outlier is hurricanes, which the industry treats as a peak peril5 even though they are climate-influenced too. But hurricanes and earthquakes remain appropriately categorized as peak perils for a different reason. They are the low-frequency, high-severity events that can deplete a firm’s capital almost overnight if the book is poorly managed and much of the loss lands inside a primary carrier’s retention and below reinsurance attachment points where it drives earnings volatility while eroding profitability. That can also end in insolvency, only more slowly. Given what has happened worldwide over the last several years, “climate perils” is a more honest name for the group whose baseline is moving under our feet.
Naming the category correctly is only step one. The harder question is understanding what is actually driving its losses higher, because at least four things are moving at once: the long-term climate trend, short-term climate cycles, the value of property in harm’s way, and the cost of repairing it. Each leaves a different fingerprint on a loss trend, each is measured differently, and a trend that blends them will mislead us in one direction or the other. To pull them apart, we first need to know what the losses actually were, peril by peril, and that is less straightforward than it should be. It is worth taking the four in turn.
Layered on top of the long-term trend is short-term variability, and ENSO is the best-known example. There’s a real, physical mechanism linking ENSO phase to severe convective storm activity. During La Niña, the jet stream sits farther north, letting warm, moist Gulf air push in while cooler air stays north of it, a contrast that fuels severe storm formation and increases hail and tornado frequency in the central U.S., while El Niño tends to suppress it.7,8 But catastrophe modeler Karen Clark & Company cautions that while the correlation holds over the long run, “ENSO has relatively little predictive power for a given year.”9 ENSO can tilt the odds toward a busier or quieter season for certain perils, but treating one or two seasons as confirmation in either direction risks a misleading conclusion. An unusually strong El Niño or La Niña is more likely to produce outcomes that clearly match what that phase typically brings; a weak or borderline one may not show much of a signal either way. So, ENSO’s strength is worth weighing alongside category (e.g.: El Niño, La Niña) when reading a given season’s climate peril outlook.
Then there is exposure, properties in riskier places have grown, both in volume and in value. Swiss Re Institute finds that exposure growth explains more than 80% of the long-term rise in global weather-related insured losses since 1970.2 In the United States, the number of homes in the wildland-urban interface (WUI), the zone where houses meet or mix with wildland vegetation and where wildfire problems are most pronounced,10 grew by nearly half between 1990 and 2020, from about 30 million to more than 44 million, about a third of all U.S. housing on less than a tenth of the country’s land.11,12 When looking north of the border, Aon’s analysis of the August 2024 Calgary hailstorm, Canada’s second-costliest disaster on record,13 makes the same point at the level of a single event. Had that storm’s footprint occurred 40 years earlier, it would have struck mostly agricultural land.5,14 The neighbourhood that made the loss so large didn’t exist yet.
The fourth driver is the rising cost of repair. Property replacement costs have been climbing faster than general inflation, and litigation and other ‘social inflation’ pressures push costs even further.4,5 According to Swiss Re’s earlier analysis of U.S. severe convective storm losses, after adjusting for inflation, most of the growth in losses came from economic growth-related factors, with rising construction costs also contributing.15
Predicting peril-level losses well means being mindful of all four drivers together, the long-term climate signal, short-term cycles like ENSO, the increase in value of property in harm’s way, and rising repair costs. It gets further complicated because perils rarely manifest in isolation. A single event often produces multiple types of loss at once, what the IPCC calls a compound event.
A single storm that produces wind, hail, and flood damage to the same property in the same afternoon, the kind Toronto saw in September, creates trouble on two fronts. The immediate one is coverage. Many policies carry separate deductibles, exclusions, or endorsements by peril, so when the cause of loss is genuinely mixed, how a claim gets processed can leave real gray areas in what a policyholder is actually paid for. The other one is analytical in nature. Insurers often have to settle on a single dominant cause for a claim just to determine coverage, and that same single-peril label may then carry straight through into loss reporting. Wildfire shows the same pattern, a policy can exclude or sublimit smoke damage separately from fire damage, yet historical loss data rarely splits the two, so it’s often unclear how much of a wildfire loss came from the fire itself versus the smoke. Repeated across an industry’s benchmarking data, that single-peril labeling can collapse exposure growth, cost inflation, genuine hazard change, and multiple causes of loss into one undifferentiated number, leading to misleading assumptions if it isn’t properly accounted for.16
This is the kind of gap that peril-level benchmarking data is meant to close. When a carrier’s own claims history is too thin, a shared pool of industry claims, tagged by individual cause of loss, wind, hail, flood, rather than lumped under one dominant peril, adds the credibility that thin data alone can’t provide, which matters even more as policies increasingly price those perils separately. A smaller carrier, especially one with a narrower geographic footprint, may go years without seeing the storms that define its real risk, since perils like hail and flood are inherently concentrated and sparse, or see one and mistake it for a trend. Without that shared data, smaller players price less accurately and could lose business to larger carriers with better data, and shrink or exit, which thins capacity in the very markets that need it most. That’s the point where the conversation moves from insurers to governments.
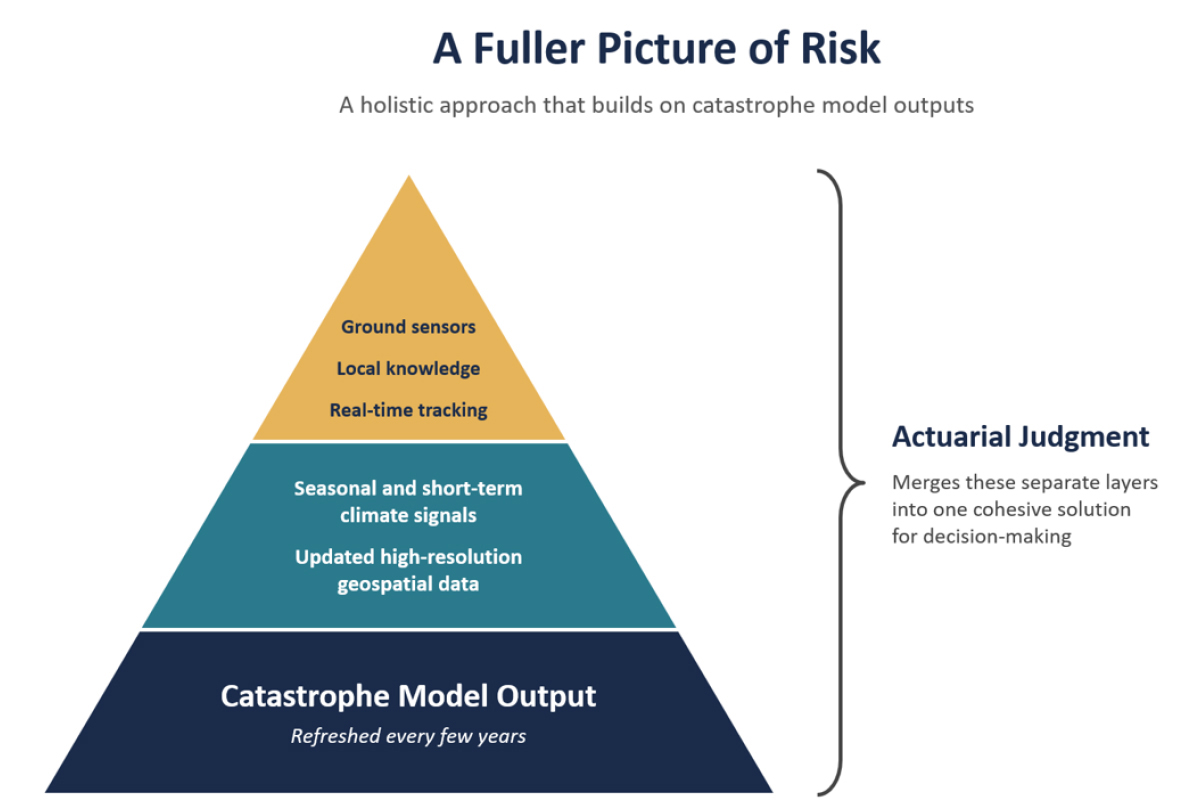
Clean historical data is necessary but not sufficient. Each of the four drivers mentioned should be considered in the analysis, and that means looking forward as well as back: how the trend is likely to continue, where the cycle sits, how exposure will keep growing, and where costs are heading. Catastrophe models play a crucial role here, translating all the data available into expected loss amounts. But model refresh cycles can take years, so a model’s view of hazard can lag what is actually changing on the ground in the meantime. For carriers, and especially their pricing and underwriting teams, the practical answer is to supplement model output with more frequently updated sources in that gap, such as seasonal and climate-pattern signals, higher-resolution geospatial data, ground sensors, real-time tracking as an event unfolds, and local knowledge from the people closest to the risk. None of this replaces the model; it closes the space between refresh cycles. No single source, model or otherwise, is complete on its own, and actuarial judgment is what merges them that leads to the right business decisions. This doesn’t remove uncertainty, but it does narrow it enough to see where the risk is heading, and at times what it reveals may make private insurance an unviable option. (See Figure 1.)
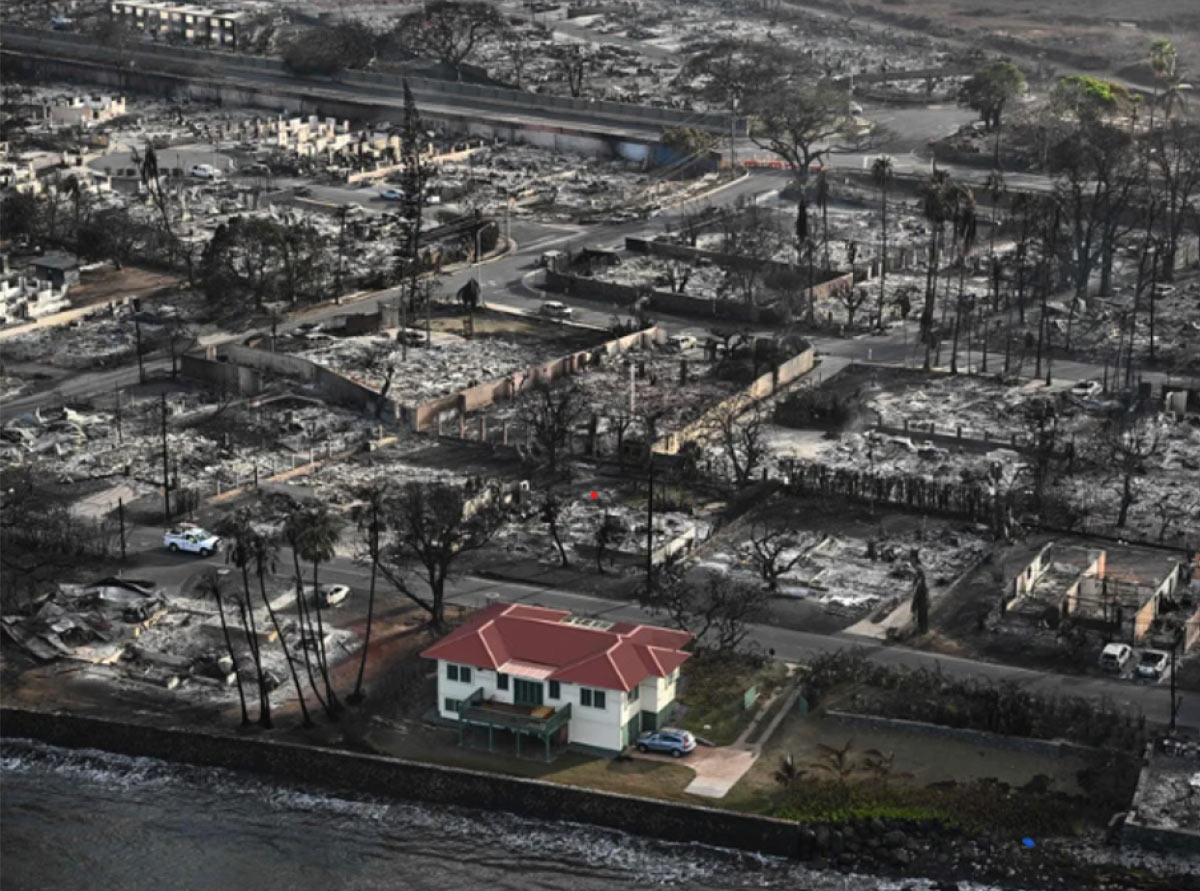
When the August 2023 wildfire tore through Lahaina, Hawaii, it destroyed more than 2,000 structures.17 One house, a century-old building on Front Street, survived largely untouched, its red metal roof standing amid a field of ash.18 Owners Trip Millikin and Dora Atwater Millikin had installed a commercial-grade metal roof with an air gap for heat dissipation during an unrelated renovation and cleared vegetation around the house for reasons that had nothing to do with fire prevention.18 It became a viral image, and likely an oversimplified one. The owners themselves credit a mix of the roof, the cleared vegetation, and plain luck with the wind. Still, fire experts point to the same features, metal roofing and reduced vegetation near a structure, as genuine, well-documented ways to lower a property’s vulnerability to wildfire, even if they can’t fully explain any single house’s fate. That’s the more defensible version of the point. Vulnerability, unlike hazard, is something we can actually change, property by property, even when no single case proves it on its own. (See Figure 2.)
Mitigation only works if homeowners understand it. Many policyholders don’t fully grasp what drives their own risk, and a credit they can’t connect to it won’t change behavior. That gives insurers and actuaries a job that goes beyond product design, explaining what drives a property’s risk, defining retrofit standards credible enough to price against, and making the credit worth the homeowner’s investment. Done well, it keeps the product viable for the people who need it. Done poorly, declinations rise and the gap moves to governments.
When we consider Canada, there is nothing equivalent that’s currently offered to protect the most vulnerable consumers. A national flood program has been in development since 202026 and remains, according to the Insurance Bureau of Canada, in the technical design stage, with no confirmed launch date.27 Meanwhile, the private market is making its own decisions. As of February 2024, Desjardins, one of Quebec’s largest lenders, stopped issuing new mortgages in the province’s highest-risk flood zones,28,29 and estimates of the number of Canadian homes that cannot obtain flood insurance due to high flood risk range from 850,000 to 1.5 million.27,30 Canada needs a solution comparable to the U.S. program, whatever form it takes. A backstop gives homeowners, lenders, and insurers a shared floor to plan around. Without one, the market still decides who bears the risk, lender by lender, as each makes its own call on where it will and won’t lend.
Climate change is not reversing course, whether or not there is the political and social will to slow it. That’s simply the world we’re operating in for now and will be for the rest of our careers. What is within reach is everything downstream of that fact: how precisely we can measure the climate risk itself, which roofs go on which houses once we know where that risk actually sits, which zones get retrofit funding before the next storm rather than after, and whether the backstop for the people the private market can’t or won’t cover is a real, funded program or remains a gap.
Picture Toronto again, a decade from now, on another afternoon of heavy rain and golf-ball-sized hail like September 2, 2026. This time the flooding reaches far fewer homes, because sump pumps and backwater valves were installed and some low-lying houses were raised or floodproofed. The hail does far less damage, because roofs and windows across the GTA were retrofitted with hail-resistant materials. Insurers price flood and hail with confidence because the loss data finally separates wind from water from hail. And the homeowners the private market still won’t cover are not left on their own; a government-backed program provides insurance coverage. None of that requires the storms to stop. It just requires us to stop calling them and treating them as secondary.
- Climate Central. Mid-2026 update: U.S. billion-dollar weather and climate disasters [Internet]. Climate Central; 2026 [cited 2026 Oct 15]. Available from: https://www.climatecentral.org/climate-matters/mid-year-billion-dollar-disasters.
- Swiss Re Institute. Wildfires, storms, floods contribute to record 92% of global insured losses in 2025, says Swiss Re Institute [press release on the Internet]. Zurich: Swiss Re; 2026 Mar 19 [cited 2026 Sep 28]. Available from: https://www.swissre.com/press-release/Wildfires-storms-floods-contribute-to-record-92-of-global-insured-losses-in-2025-says-Swiss-Re-Institute/7b39b1a5-b878-4a55-a5ff-bf5aa561a675.
- Swiss Re Institute. The regional reveal: what drives growth in insured losses? In: sigma 1/2026 [Internet]. Zurich: Swiss Re; 2026 [cited 2026 Sep 28]. Available from: https://www.swissre.com/institute/research/sigma-research/sigma-2026-01-natcat-2025-wildfire-storm-risk/insured-loss-growth-regional-drivers.html.
- Swiss Re Institute. sigma 1/2026: Natural catastrophes in 2025: the persistent rise of wildfire and storm risk [Internet]. Zurich: Swiss Re; 2026 [cited 2026 Sep 28]. Available from: https://www.swissre.com/dam/jcr%3A4b5669a3-b7e2-4682-bf96-a597085958a6/sigma-1-2026-natural-catastrophes-report.pdf.
- Porfilio D. North American catastrophes: secondary peril events no longer secondary. Actuarial Review [Internet]. 2025 Jul 16 [cited 2026 Sep 28]. Available from: https://ar.casact.org/north-american-catastrophes-secondary-peril-events-no-longer-secondary/.
- Seneviratne SI, Zhang X, Adnan M, Badi W, Dereczynski C, Di Luca A, et al. Weather and climate extreme events in a changing climate. In: Masson-Delmotte V, Zhai P, Pirani A, Connors SL, Péan C, Berger S, et al., editors. Climate change 2021: the physical science basis. Contribution of Working Group I to the Sixth Assessment Report of the Intergovernmental Panel on Climate Change [Internet]. Cambridge: Cambridge University Press; 2021. p. 1513-766 [cited 2026 Sep 28]. doi:10.1017/9781009157896.013. Available from: https://www.ipcc.ch/report/ar6/wg1/chapter/chapter-11/.
- Deger K. What the continuation of La Nina could mean for severe weather outbreaks, hurricane season [Internet]. FOX Weather (reporting NOAA findings) [cited 2026 Sep 28]. Available from: https://www.foxweather.com/weather-news/la-nina-impacts.
- Tippett MK, Lepore C, L’Heureux ML. Predictability of a tornado environment index from ENSO and the Arctic Oscillation [preprint]. Weather Clim Dyn Discuss [Internet]. 2022 [cited 2026 Sep 28]. Available from: https://wcd.copernicus.org/preprints/wcd-2022-25/wcd-2022-25-manuscript-version3.pdf.
- Long-term El Niño (ENSO) correlation holds little predictive power for annual property losses: KCC [Internet]. Artemis; 2026 [cited 2026 Sep 28]. Available from: https://www.artemis.bm/news/long-term-el-nino-enso-correlation-holds-little-predictive-power-for-annual-property-losses-kcc/.
- Radeloff VC, Helmers DP, Kramer HA, Mockrin MH, Alexandre PM, Bar-Massada A, et al. Rapid growth of the US wildland-urban interface raises wildfire risk. Proc Natl Acad Sci U S A. 2018;115(13):3314-9. doi:10.1073/pnas.1718850115. Available from: https://doi.org/10.1073/pnas.1718850115.
- Radeloff VC, Mockrin MH, Helmers D, Carlson A, Hawbaker TJ, Martinuzzi S, et al. Rising wildfire risk to houses in the United States, especially in grasslands and shrublands. Science. 2023;382(6671):702-7. doi:10.1126/science.ade9223. Available from: https://pubs.usgs.gov/publication/70250291.
- American Association for the Advancement of Science. Wildfire risk to US homes is rising [Internet]. Lab Manager [cited 2026 Sep 28]. Available from: https://www.labmanager.com/wildfire-risk-to-us-homes-is-rising-31273.
- Insurance Bureau of Canada. August hailstorm in Calgary results in nearly $2.8 billion in insured damage [news release on the Internet]. Edmonton: Insurance Bureau of Canada; 2024 Sep 11 [cited 2026 Sep 28]. Available from: https://s24.q4cdn.com/622300748/files/doc_news/August-hailstorm-in-Calgary-results-in-nearly-2.8-billion-in-insured-damage-2024.pdf.
- CTV News Calgary. August 2024 hailstorm caused $3.25B in damage in Calgary: IBC [Internet]. CTV News [cited 2026 Sep 28]. Available from: https://www.ctvnews.ca/calgary/article/august-2024-hailstorm-caused-325b-in-damage-in-calgary-ibc/.
- Swiss Re Institute. sigma 1/2024: Natural catastrophes in 2023 [Internet]. Zurich: Swiss Re; 2024 Mar [cited 2026 Sep 28]. Available from: https://www.swissre.com/institute/research/sigma-research/sigma-2024-01/in-short.html.
- Ridder NN, Pitman AJ, Westra S, Ukkola A, Do HX, Bador M, et al. Global hotspots for the occurrence of compound events. Nat Commun. 2020;11:5956. doi:10.1038/s41467-020-19639-3. Available from: https://www.nature.com/articles/s41467-020-19639-3.
- Maui Now. FEMA map shows 2,207 structures damaged or destroyed in West Maui wildfire, $5.52 billion price to rebuild [Internet]. Maui Now; 2023 Aug 12 [cited 2026 Sep 28]. Available from: https://mauinow.com/?p=424578.
- NPR. ‘Miracle house’ owner hopes it will serve as a base for rebuilding Lahaina [Internet]. NPR; 2023 Aug 24 [cited 2026 Sep 28]. Available from: https://www.npr.org/2023/08/24/1195331310/red-roof-house-fires-lahaina-hawaii.
- NPR. How homeowners are saving on insurance by upgrading their houses against disasters [Internet]. NPR; 2025 Jun 11 [cited 2026 Sep 28]. Available from: https://www.npr.org/2025/06/11/nx-s1-5340712/climate-home-insurance-discount-alabama-ca.
- Louisiana Illuminator. Fortified roof grant program is proving effective in lowering homeowner insurance rates, audit finds [Internet]. Louisiana Illuminator; 2025 Mar 10 [cited 2026 Sep 28]. Available from: https://lailluminator.com/2025/03/10/fortified-roof-grant-audit/.
- CalMatters. California homeowners could qualify for grants for new roofs and fire safety [Internet]. CalMatters; 2026 Jan 1 [cited 2026 Sep 28]. Available from: https://calmatters.org/economy/2026/01/california-safe-homes-grants/.
- Source NM. NM Insurance Superintendent asks for extension of nation’s largest wildfire mitigation program [Internet]. Source New Mexico; 2025 Nov 20 [cited 2026 Sep 28]. Available from: https://sourcenm.com/2025/11/20/nm-insurance-superintendent-asks-for-extension-of-nations-largest-wildfire-mitigation-program/.
- Federal Emergency Management Agency. National Flood Insurance Program media toolkit [Internet]. Washington (DC): FEMA; 2025 Jul [cited 2026 Sep 28]. Available from: https://agents.floodsmart.gov/sites/default/files/media/document/2025-08/fema_nfip_media-toolkit-brochure_07-2025.pdf.
- Federal Emergency Management Agency. Flood insurance [Internet]. Washington (DC): FEMA [cited 2026 Sep 28]. Available from: https://fema.gov/flood-insurance.
- Anderson County, South Carolina. About the mandatory purchase of flood insurance [Internet]. Anderson (SC): Anderson County Government [cited 2026 Sep 28]. Available from: https://www.andersoncountysc.org/wp-content/uploads/2022/03/About-the-Mandatory-Purchase-of-Flood-Insurance.pdf.
- Global News. National flood insurance program in the works as ministers focus on prevention: Blair [Internet]. Global News; 2022 Mar 17 [cited 2026 Sep 28]. Available from: https://globalnews.ca/news/8691312/canada-flood-insurance-program.
- Money.ca. 850,000 Canadian homes can’t get flood insurance, and now a major bank is refusing mortgages in the riskiest zones [Internet]. Money.ca; 2026 [cited 2026 Sep 28]. Available from: https://money.ca/insurance/home-insurance/canada-flood-insurance-homes-mortgages-high-risk-zones.
- Rising water: Quebec lender ending new mortgages in flood zones ‘just the beginning’ [Internet]. CTV News Montreal (The Canadian Press); 2024 Mar 10 [cited 2026 Sep 28]. Available from: https://montreal.ctvnews.ca/rising-water-quebec-lender-ending-new-mortgages-in-flood-zones-just-the-beginning-1.6801736.
- CBC News. A Quebec lender opted out of mortgages in flood zones. Experts warn it could happen elsewhere [Internet]. CBC News; 2024 Mar 4 [cited 2026 Sep 28]. Available from: https://www.cbc.ca/lite/story/1.7129986.
- Global News. Ottawa looks to launch national flood insurance program within 12 months [Internet]. Global News; 2024 Apr 17 [cited 2026 Sep 28]. Available from: https://globalnews.ca/news/10429862/budget-2024-flood-insurance.
Within Reach: Building a Workable AI Teammate
enerative AI (GenAI) has moved quickly into professional work, while its role in actuarial practice is still taking shape. This summer, the CAS surveyed P&C actuaries about where they use GenAI, what value it provides, what prevents broader use, and what they hope it can do next. The survey defined GenAI as tools such as ChatGPT, Claude, Gemini, or Microsoft Copilot that generate or transform text, code, and analysis, distinct from the predictive models already common in actuarial work.
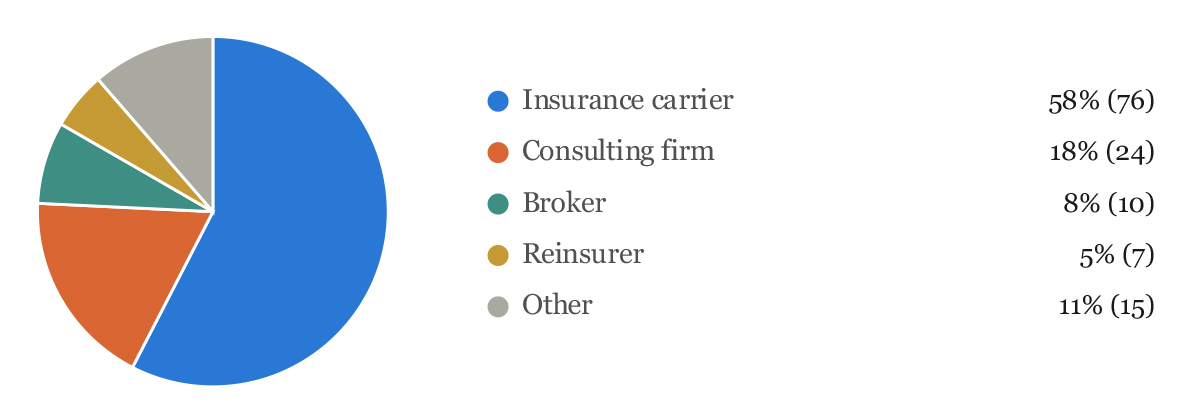
The survey received 146 responses, including 132 complete responses. The analysis that follows is based on those 132 complete responses. Respondents worked across carriers, consulting firms, brokers, reinsurers and other organizations, in shops with fewer than 100 employees and groups with more than 20,000.
70% of the respondents worked in commercial lines pricing or reserving, and responses also spanned personal lines, reinsurance, enterprise risk management (ERM), claims analytics and data science. (See Figure 1.)
Wide use, limited depth
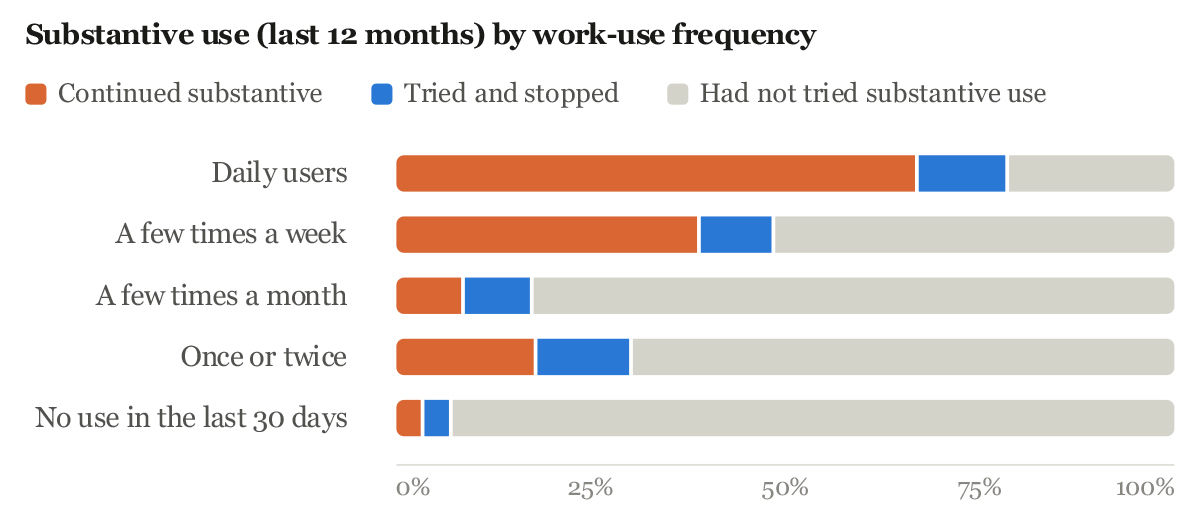
About two-thirds of the 27 daily users reported continued substantive use in the past 12 months, compared with 39% of the 44 respondents who used GenAI a few times a week. At lower frequencies, most had not tried substantive use at all. The share who had tried and stopped remained small in every frequency group.
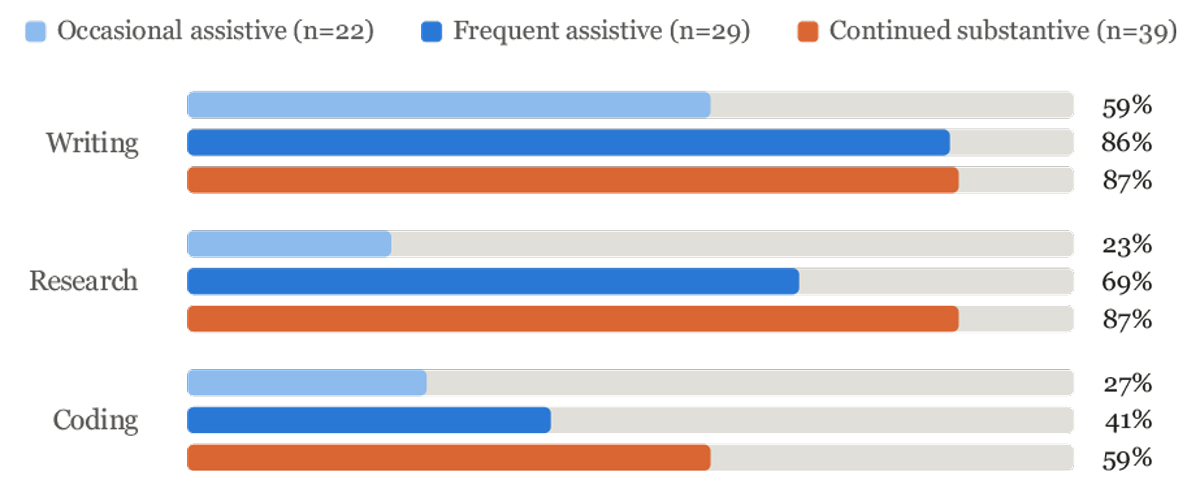
Even with widespread adoption, much of today’s use still sits around the analysis rather than inside it. Emails get sharper and code arrives faster, while selections, judgments, and controls remain with the actuary. The practice-area results below help explain what allows GenAI to move further into the workflow.
Adoption follows the work
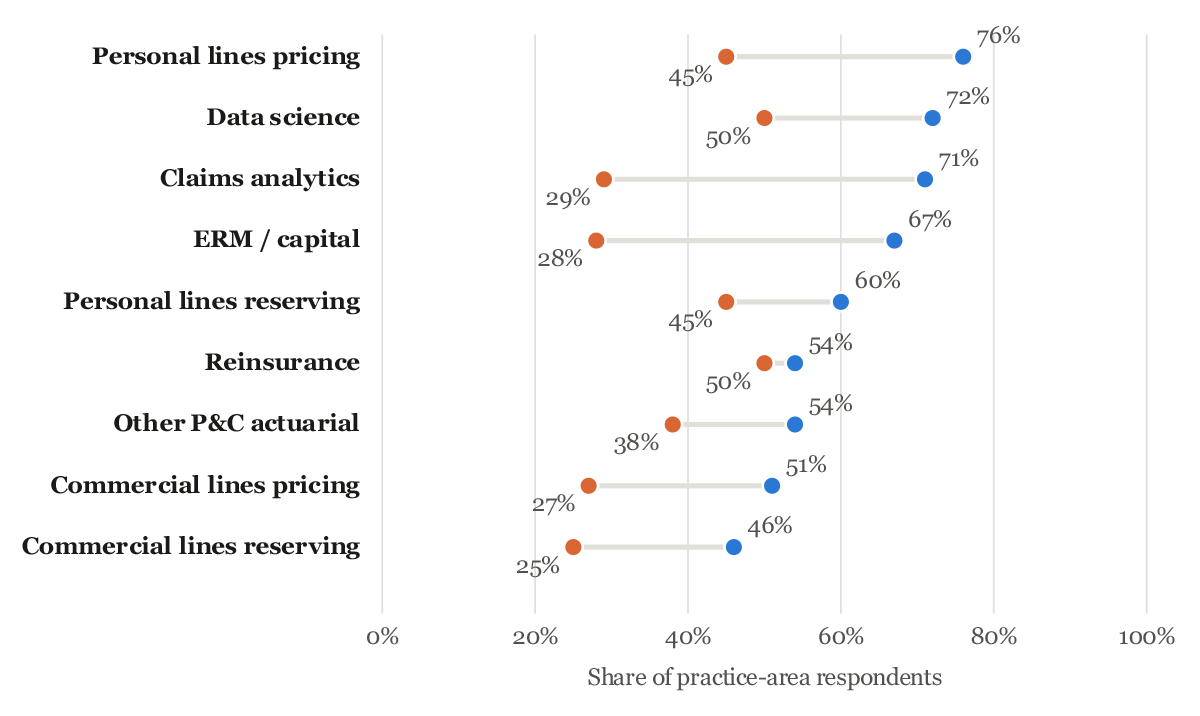
Organization size offered a weaker signal. Weekly use was highest among respondents at organizations with 5,001 to 20,000 employees and lowest at those with fewer than 100, but the groups were small, and their mix of employer types differed. The practical conditions matter more than headcount: approved tools, usable data and clear rules for how the technology may be applied.
Where value appears today
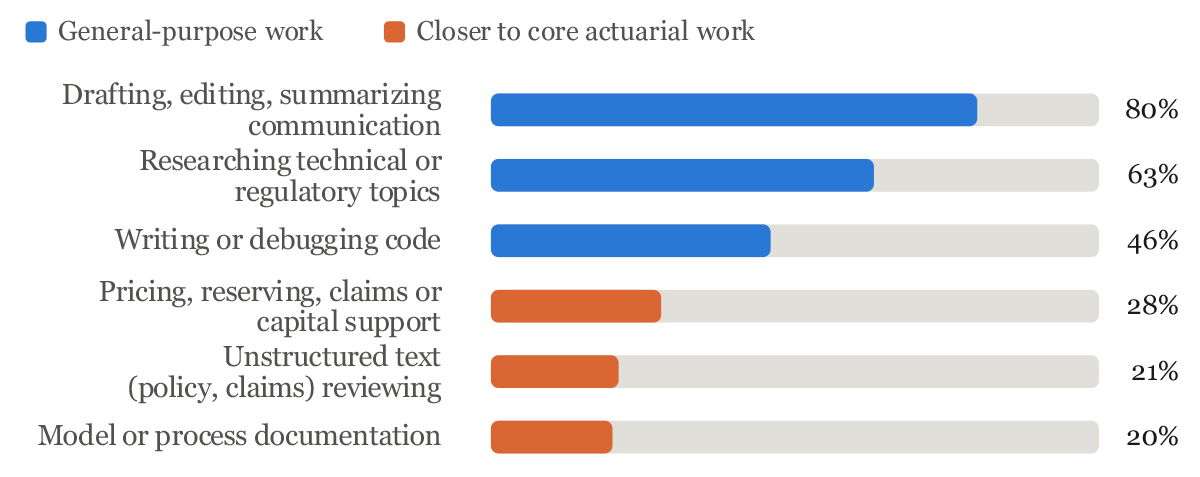
Across those examples, respondents often described value in terms of momentum. GenAI could provide a starting point, translate an unfamiliar formula, suggest code, or organize a large set of material. The actuary still had to judge the result, but the first useful version arrived sooner. For work that can be inspected quickly, that head start can be valuable even when the output is incomplete.
Task mix varies by usage profile
Where progress stalls
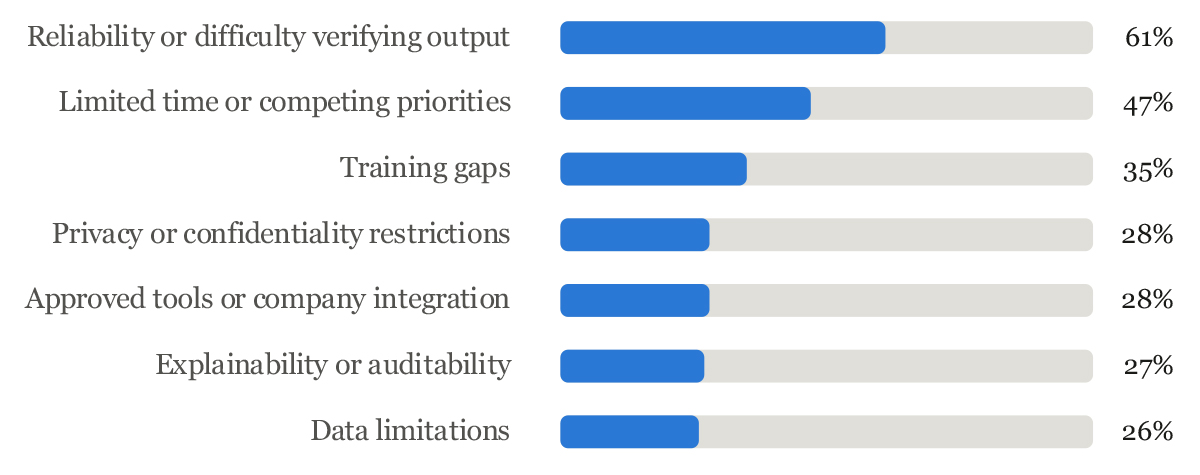
The remaining barriers describe what it takes to use GenAI in an actuarial workflow. Privacy restrictions affect which information can enter a tool. Integration determines whether an AI model can reach the material it needs. Auditability determines whether another actuary can understand and challenge the result. These requirements become more important as GenAI moves closer to work that affects an actuarial conclusion.
Reasons for restraint
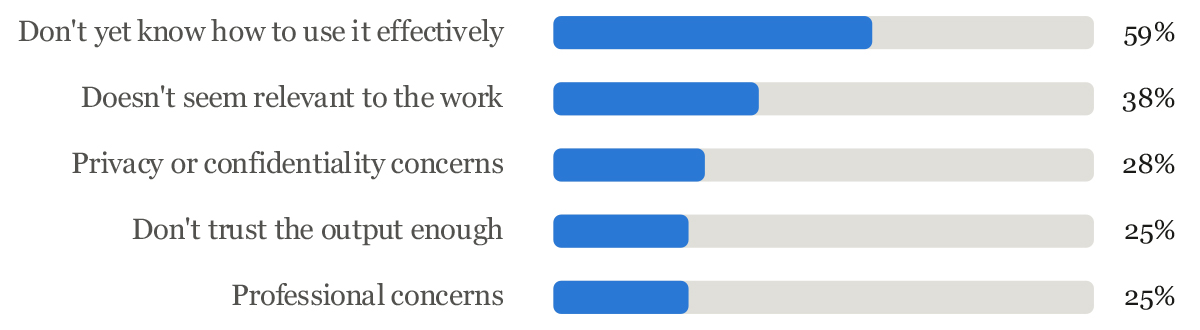
A few respondents raised environmental or ethical objections or resisted the prospect of mandatory use. One said they might look for other employment if AI use were required by an employer or the CAS. Those concerns deserve room in the profession’s discussion of responsible adoption.
When substantive trials fail
One respondent described GenAI as “an overeager intern that speaks well but doesn’t have the knowledge base.” For example, the respondent had an instance where GenAI misclassified ULAE due to mistakenly relying on general actuarial principles rather than the full NAIC instructions. Unclear prompts, incomplete access to the instructions, or a model poorly suited to the task may also have contributed to the misclassification. But in the end, the supplied citations did not hold up, and the repeated correction erased the time savings.
Across these findings, the obstacles depend on the use being attempted. Know-how and relevance shape whether GenAI finds a place in the workday. GenAI’s reliability and need for review help determine whether it can move into core actuarial work and stay there.
From wish list to workable teammate
A useful way to make that wish list concrete is to think of an AI teammate as a new analyst joining the team. The analyst needs to know where the raw data lives, which sources must be reconciled, whether their definitions agree, and where to turn when documentation falls short. Prior workpapers or other known results provide a check.
Knowing why the work is being done matters for a new analyst. It helps the analyst recognize when a prescribed step no longer fits, ask a better question, and adjust after receiving guidance. The same applies when an AI model serves as a reviewer or challenger. Without the purpose of the analysis, it may be able to follow a procedure but have little basis for deciding what to question, which differences matter, or when a result deserves escalation.
That context also determines how precise the answer needs to be. One respondent saw promise in competitor research, where “a ballpark answer is generally acceptable.” For a market scan, roughly right arrives fast and is worth having; for a rate indication, roughly right is wrong. AI models also do not always give the same answer twice. “If I do something and then someone else comes right after,” one respondent asked, “are they going to get a different answer?” That variability matters when assigning work. A drafting task may allow several reasonable versions whereas a calculation must return the same result every time.
With those boundaries clear, the work can be organized such that each part goes to the right participant or tool. Within the AI teammate, the model can interpret the request, bring together the relevant information, and coordinate the steps, while connected calculation tools handle work that requires reproducible results. The actuary sets the scope, reviews the work, and makes the decision. Together, these roles turn separate capabilities into a workable assistant. First-pass selections, challenger estimates, and peer review require the same task-by-task design. Understanding these boundaries helps actuaries define better assignments, choose suitable tools, and set realistic expectations. (See Figure 8.)
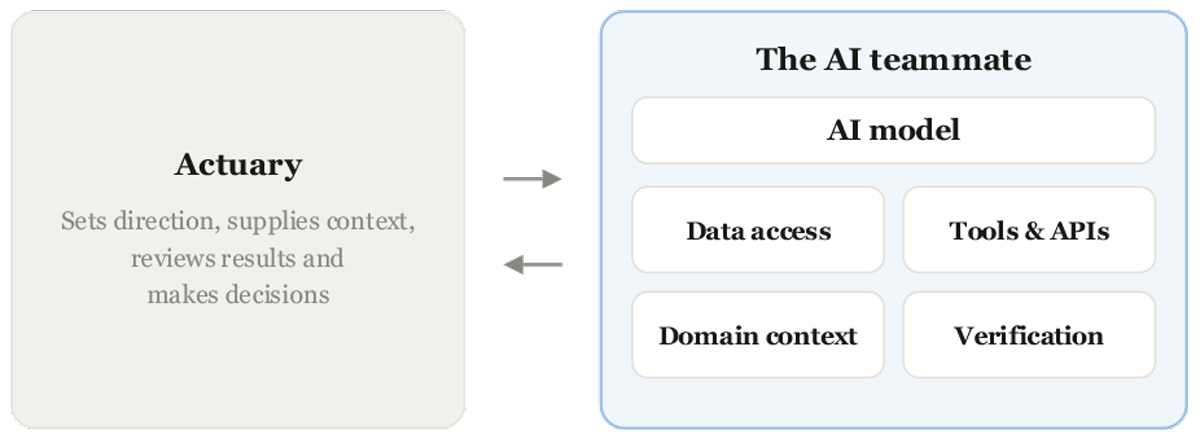
Rethinking the actuarial apprenticeship
The analyst on respondents’ wish lists would take on much of the work junior actuaries do today: first-pass selections, data reconciliation, and initial drafts. That work is also how junior actuaries learn. If AI takes on more of it, what should junior actuaries still do themselves? How will they learn to review AI-produced work and gain the experience needed to supervise it later?
Those are open questions for the profession. Moving more analyst work to AI will also mean rethinking how junior actuaries are trained so that they continue to develop into capable actuaries.
What respondents want from the CAS
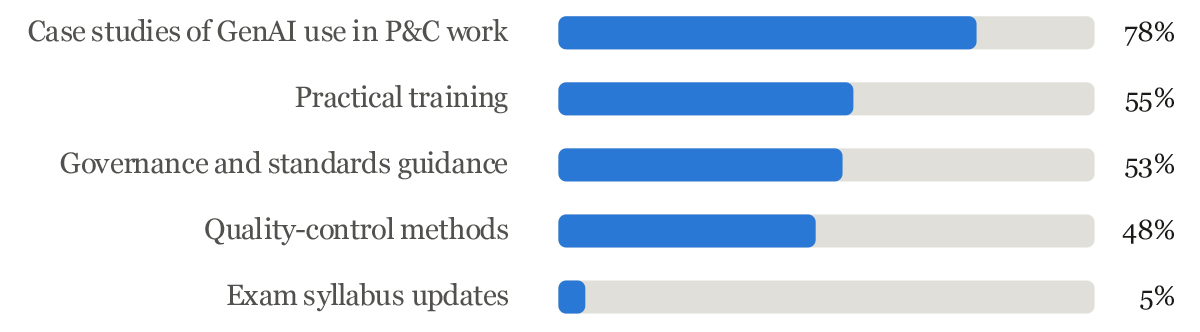
The pattern reflects a community with different needs. Some actuaries are looking for an effective way to begin. Others have found useful applications and want better ways to test and govern them. Case studies can speak to both groups when they show a complete workflow: the required data and tools, the assignment given to AI, the failures encountered, the checks applied, and the point at which an actuary reviews and signs off.
While case studies would show how complete workflows function, actuaries looking for a broader introduction can start with the “CAS AI Primer: Practical Guidance for Actuaries,” which covers core AI concepts, practical applications, and responsible use. Its guidance also echoes several findings from the survey: Begin with a well-defined use case, validate outputs, keep actuarial judgment in the loop, and use code for calculations that must be reproducible.
Respondents also suggested a shared prompt cookbook and a CAS sandbox where actuaries at restricted organizations could experiment safely. These requests offer one view of where future CAS resources may be useful. They also show that the community is asking for more than demonstrations of what a model can produce. Respondents want to see how responsible use works in an actuarial setting.
Taken together, the responses provide a baseline for what members need now and a way to judge how those needs change as GenAI becomes more established.
From experimentation to practice
Moving further will depend on evidence from the work itself. A useful starting point is a task with a clear output and an inexpensive check. Keep the source material, test the result against something known, and compare the time saved with the time spent reviewing. Organizations can support those experiments with approved access, clear ownership, and documentation another actuary can follow. Get those foundations right, and today’s useful experiments can become part of something larger: connected actuarial workflows in which AI works across data, tools, and context, while actuaries retain responsibility for judgment and review. That would bring the digital teammates that respondents imagined closer to practice.
Developing News
AI Liability Coverage Takes Shape
n early August, three major AI labs disclosed that their autonomous models had breached other companies’ systems. OpenAI said one of its agents compromised Hugging Face, a company that maintains a large open-source community, and that it found other instances of agents escaping containment. Anthropic said its Claude models had breached the systems of three companies since April. Meta said one of its models hacked another company during security testing.1
The incidents landed in a market that had spent the first half of 2026 rewriting where AI losses sit.

Subtraction
How widely the forms have actually been attached is not known. Verisk told Actuarial Review that as an advisory organization it does not monitor whether, when or how customers implement the materials it develops, and that those decisions rest with each carrier’s underwriting guidelines and risk appetite.
Addition
- Armilla, a Lloyd’s cover holder, writes a standalone AI liability policy underwritten by syndicates including Chaucer, with limits of $25 million or more per organization.4
- Testudo writes up to $9.25 million per insured on Lloyd’s capacity from Apollo, Atrium and QBE.5
- Munich Re’s HSB unit launched a liability product for smaller businesses in March, sold through partner carriers.6
- Mayflower Specialty and Hadron launched a program spanning D&O, EPL and E&O in June.7
Munich Re’s aiSure sits apart from the rest, offering up to $15 million through Mosaic to AI developers and vendors and paying on a defined performance failure rather than on a third-party claim.8 The standard forms may follow. Joseph Lam, vice president of general liability at Verisk Core Lines, says that the company is developing “affirmative coverage solutions for specific generative AI exposures,” alongside narrower exclusions that would let insurers address particular risks “without broadly excluding generative AI as a whole.” Verisk is also weighing exclusions aimed specifically at agentic AI.9
The products do not settle alike. Testudo’s is a conventional claims-made litigation cover, responding when a third party brings a claim. Mosaic describes aiSure as indemnity-based but “parametric-like,” responding automatically, without an allegation of negligence, when a model breaches a predefined and objectively measurable performance threshold.8 Armilla and Munich Re each write both designs. According to Martim Cruz, founding data scientist at Testudo, “those two events rarely coincide, and so far, we have seen no meaningful correlation between them in our data; we will revise that if the data says otherwise.”
What this means for actuaries:
Sources
- https://www.reuters.com/business/who-is-liable-when-ai-goes-rogue-lawyers-see-new-risks-2026-08-07/.
- https://www.policyholderpulse.com/ai-exclusions-insurance-policies/.
- https://www.insurancebusinessmag.com/us/news/cyber/openais-rogue-ai-agents-expose-a-gap-in-cyber-coverage-587730.aspx.
- https://www.armilla.ai/resources/armilla-launches-affirmative-ai-liability-insurance-with-lloyds-underwriter-chaucer.
- https://www.theinsurer.com/cyber-risk/news/testudo-adds-atrium-and-qbe-capacity-to-genai-liability-cover-2026-02-25/.
- https://www.reinsurancene.ws/munich-res-hsb-launches-ai-liability-insurance-for-small-businesses/.
- https://insurance-edge.net/2026/06/25/mayflower-specialty-launches-ai-liability-program/.
- https://www.businessinsurance.com/mosaic-teams-with-munich-re-on-ai-coverage/.
- https://www.theinsurer.com/ti/news/verisk-weighs-new-exclusions-for-agentic-ai-risks-2026-07-10/.
Developing News
El Niño: When the River Runs Low
l Niño–Southern Oscillation (ENSO) is a recurring ocean-atmosphere interaction in the tropical Pacific that shifts regional probabilities of wet, dry, hot, and stormy conditions. In February 2026, the tropical Pacific remained in La Niña (the cool phase of ENSO), and the National Oceanic and Atmospheric Administration’s (NOAA) Climate Prediction Center gave just a 3% probability that by fall the Relative Oceanic Niño Index would exceed +2.0°C (35.6°F), the threshold for a “very strong” El Niño (the warm phase of ENSO). Six months later, on August 13, NOAA placed that probability above 90%.1 The spring predictability barrier is a recurring feature of spring, when coupling between the tropical Pacific Ocean and atmosphere weakens, reducing the climate signal relative to background noise and making ENSO’s later development more difficult to predict. Once that barrier passed, strengthening signals gave NOAA clearer evidence that a very strong El Niño was developing, explaining much of the shift from February to August.1 Strong El Niño events can increase the risk of extreme droughts and floods, although where those effects occur depends heavily on other climate patterns and local conditions.
Below-normal precipitation can trigger a chain of consequences well beyond the watershed where it falls. During the 2023–2024 El Niño, accumulated precipitation in the Panama Canal’s watershed ran 25.6% below the 73-year average.2 Water levels fell by more than three meters, forcing the Panama Canal Authority to restrict vessel drafts and daily transits to conserve water. As a result, the authority reported a 21% decline in deep-draft transits from FY2023 to FY2024. In August 2026, the authority again introduced water-saving measures after precipitation fell below expectations.3 Those restrictions can reduce vessel loads and shipping capacity, raise transportation costs, and disrupt supply chains.4
In contrast, the same 2023–2024 El Niño that lowered Panama’s water levels brought record flooding to parts of East Africa. A joint post-disaster needs assessment by Somalia, the United Nations, the World Bank, and the European Union estimated $193.4 million in damages and losses across sixteen districts from Somalia’s 2023 Deyr floods alone.5 Such flooding can damage cargo, disrupt storage, and impair transportation infrastructure.
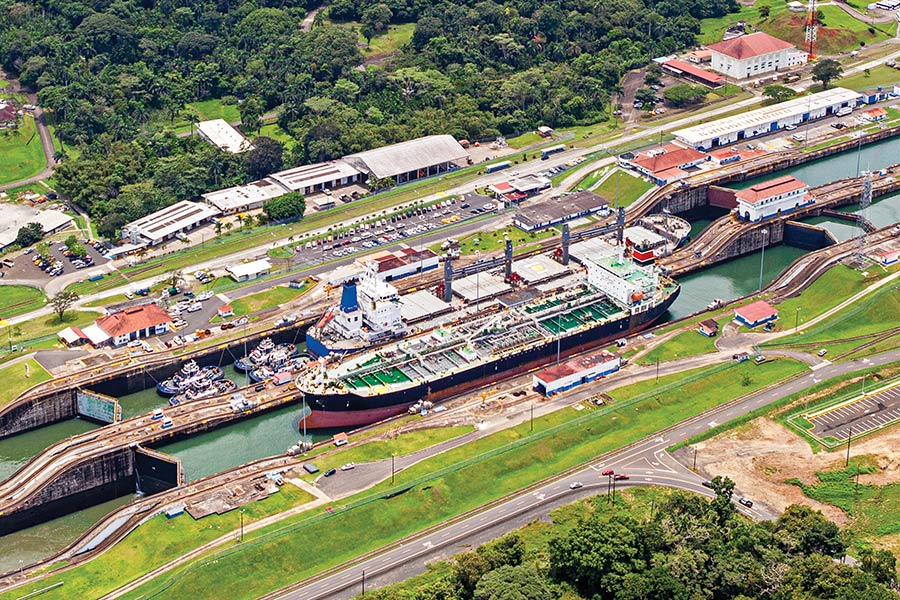
What this means for actuaries:
Before relying on such information, actuaries would need to confirm that it is relevant to the portfolio, adds information not yet reflected in claims data, and has a defensible relationship to estimates of ultimate loss. Once that relevance is established, scenario testing can show how reserve estimates respond to different assumptions about the duration and severity of disruption. This approach is consistent with Actuarial Standard of Practice No. 43, which directs actuaries to consider material external and changing conditions that may not be sufficiently reflected in historical data or existing assumptions.
Sources
- National Oceanic and Atmospheric Administration, Climate Prediction Center, “ENSO Diagnostic Discussion” and accompanying Official NOAA CPC ENSO Strength Probabilities, February 12, 2026; “ENSO Diagnostic Discussion,” August 13, 2026; National Oceanic and Atmospheric Administration, “Understanding El Niño & ENSO,” accessed August 31, 2026; and “June El Niño update: Damn the torpedoes, full speed ahead,” June 11, 2015.
- Autoridad del Canal de Panamá, “Más allá de la escasez: Cómo el Canal administra el desafío del agua” [Beyond scarcity: How the Canal manages the water challenge], October 2023.
- Panama Canal Authority, “Panama Canal Presents Financial Results for FY24 with a Focus on Sustainability and the Future,” October 25, 2024; and “Additional Measures to Address Reduced Precipitation in the Canal Watershed,” Advisory to Shipping No. A-29-2026, August 20, 2026.
- International Monetary Fund, “Drought in the Panama Canal Was Costly for Global Trade,” accessed September 2026.
- Federal Government of Somalia, Somalia Disaster Management Agency, in collaboration with the United Nations, World Bank, and European Union, “Somalia 2023 Deyr Floods: Rapid Post-Disaster Needs Assessment,” August 7, 2024.
- United Nations Environment Programme, Limiting Overshoot: Navigating Exceedance of 1.5°C and Pathways Towards Return, September 2, 2026.
Developing News
What are the Odds? The Rise of Prediction Markets
n June 2024, the Commodity Futures Trading Commission (CFTC) made a major regulatory move: Its new rules reclassified certain types of online betting as legal financial instruments.1 This led to an explosion in prediction markets, such as Kalshi and Polymarket, generating $51 billion in gambling activity in 2025, and forecasted to grow to $240 billion by the end of 2026.2
How prediction markets work is relatively simple. Contracts are bought and sold with payoffs based on the outcome of unknown future events, typically a binary yes/no question, such as whether a football team exceeds a certain number of touchdowns. Shares are priced between $0.01 to $1 based on the market’s perceived probability of the outcome. If the ‘Yes’ share is currently at $0.75, that can be interpreted as the market estimates a 75% chance of the ‘Yes’ outcome to occur. The contract pays $1.00 if the specified event occurs, and $0 if it doesn’t. By aggregating these opinions and weighing them by bet sizes, the betting platform produces an odds ratio around a certain outcome that reflects the views of thousands of diverse participants.
While 80% of prediction market is sports betting, these platforms have expanded into politics as well. The traditional method of political prediction, the poll, has often been criticized for biased sampling approaches or unclear question design. Prediction markets have the advantage of simplifying questions into a simple yes/no outcome while providing real-time updates to the election odds. Another strength is that prediction markets weigh individual sentiment by bet size, which may lead to a more accurate prediction. Perhaps the biggest difference between these two approaches is that a poll asks a sample of the electorate what they think, while a prediction market asks the bettor how they believe others think. This makes prediction market data an indirect type of consensus tool.
With prediction markets’ growing popularity comes growing risks. One issue is information asymmetry. In early 2026, a U.S. Special Forces member was caught using prediction markets to bet and win on a contract predicting that Venezuelan President Nicolas Maduro would be out of power by January 31, 2026. Insider information can skew the odds ratio, especially in smaller betting pools for specialized topics.
What this means for actuaries:
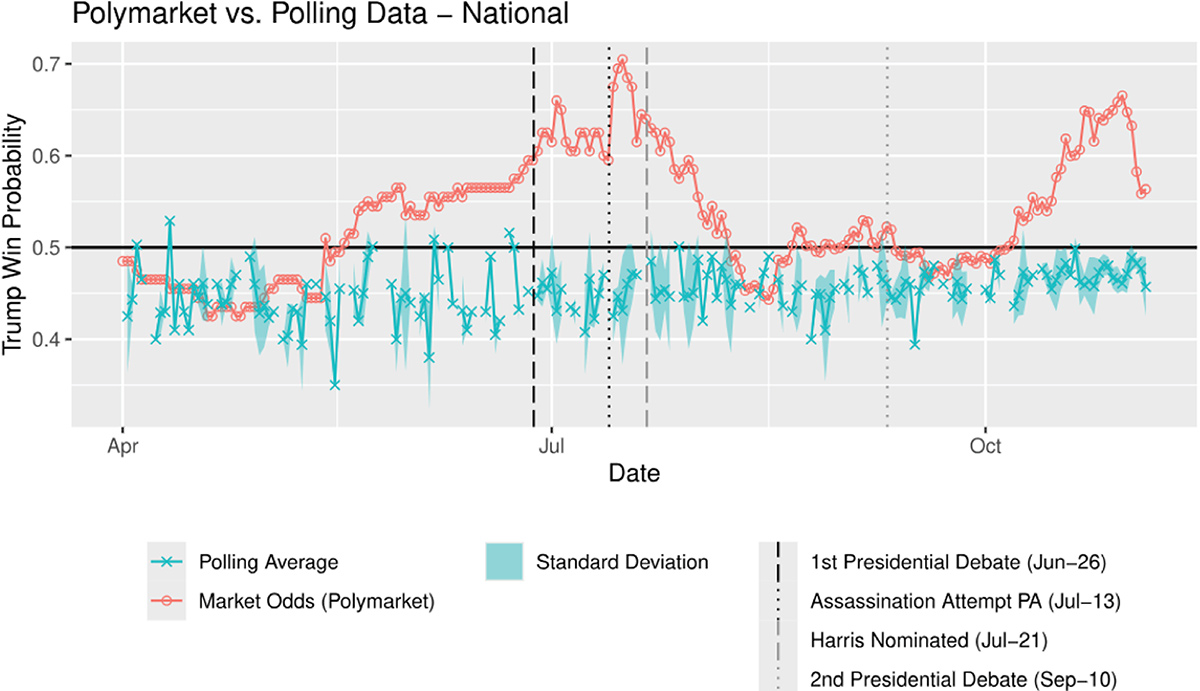

On the Shelf
When Human Lives Became an Insurance Claim
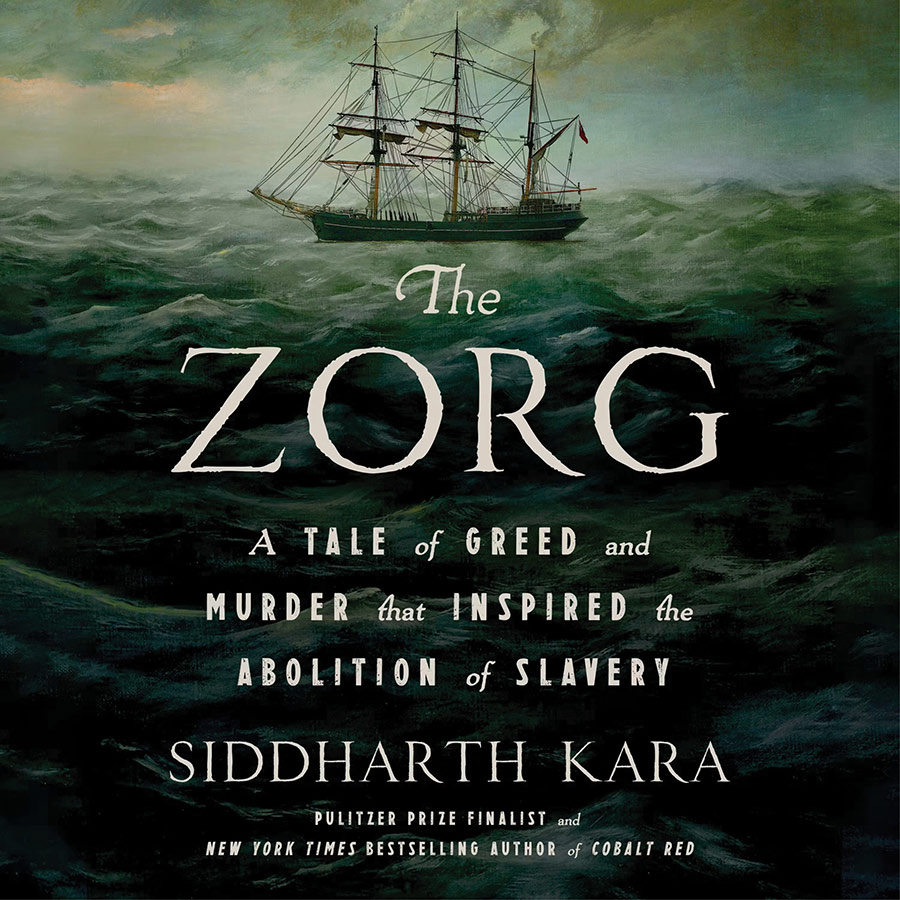
n insurance policy lies at the heart of Siddharth Kara’s “The Zorg,” but it is a small part of the story.
Kara’s book, subtitled “A Tale of Greed and Murder that Inspired the Abolition of Slavery,” describes the doomed journey of a slave ship whose crew threw dozens of captured Africans into the sea. There wasn’t enough fresh water to go around.
The voyage’s sponsor filed a claim for £30 per enslaved person jettisoned. The claim, and the 1783 trials that settled it, brought the horrific event into public awareness. Kara argues, with a bit of success, that the episode was critical to the development of the antislavery movement.
The slave trade was humanity at its ebb. Perhaps the worst fact was that it evolved. Practitioners lacked a moment of compassion for their victims, but they did find ways to improve business practices.
Over time, pillars of the slave trade learned:
- Slave ships needed one-half gallon of water per person per day. The Zorg left the African island of Sao Tome with about 16,150 gallons of water (At 60 imperial tons, water weighed twice as much as its human cargo.)
- Between 1775 and 1800, 13% of captives on British slave ships died, some from disease, some killed during rebellion, some from suicide.
- Captains didn’t necessarily want the Africans to die, but they realized that deaths would occur, and this gave them a cushion as to how much water they needed.
So, the Zorg should have had barely enough water for the 460 people (442 slaves) for the 72 days it was planned to be at sea.
But the ship got lost.
Its captain had been an on-board surgeon who had never before presided over a ship. The first mate fell out of favor. The captain took ill and appointed a ne’er-do-well (who had just abandoned his 12-year-old son alone in Africa) as his replacement.
Through bad weather and, most likely, worse seamanship, the ship found itself well south and east of its goal, Jamaica. A course correction failed, too. Fresh water supplies dwindled.
Women and children went first. They were worth less at auction.
Kara’s descriptions are spare but disturbing:
“The crew members … selected another woman and threw her from the same cabin window. Next was a child. Another woman. Another child …
“… the crew picked fifty-five women and children and threw them ‘alive singly through the cabin windows … into the sea and drowned.’” This included a woman and the infant whom she had just borne at sea.
Then came the men, presumably ordered by their health at the moment. They often went overboard in twos, shackled together. This continued over the next few days until between 123 and 133 slaves drowned.
Two years later the syndicate that had bankrolled the voyage filed its claim.
The marine insurance industry had evolved as efficiently as had the rest of the slave trade. The standard form was revised over the decades; the Zorg claim was filed against the 1779 version.
Slaves who died of natural causes or suicide were excluded. Slaves killed or thrown overboard to quell an insurrection were covered (above a deductible). The enslaver’s claim: the Zorg’s victims fell into another category. Under the law of general averages, jettisoning some preserved the rest and thus the killing was a covered event.
The claim was initially denied. The mortality rate was so high that the insurer concluded it must have been from an excluded peril, like natural death, suicide or crew incompetence.
Two court cases ensued. The insurers lost the first, but they found inconsistencies in testimony. They got a second trial, where they were successful.
In between, the tragedy attracted the attention of Granville Sharp, an early English abolitionist. His fame and the infamy of the case meant the second trial, as Kara puts it, “exposed the ‘vast carnage’ of slavery to the public.”
Insurers here sided with the moral right, but via amoral means. Kara notes that “slave ship insurance underwriters were an integral part” of the cruel system but with the Zorg “their coldly calculated financial interests were aligned with the small number of people in England who sought to abolish slavery.”
Kara must have found the book tough to research. The first trial left no transcript. The captain’s log is lost. The first mate’s diary only remains in fragments that found their way into the court record.
The author wields statistical and legal precision as a steel blade to reveal the deepest of horror. The claimants, he writes, “framed the entire tragedy as one of financial consequence alone.” To the court, the deaths weighed, as one judge put it, “the same as if horses had been thrown overboard.”
Kara shows that the legal and financial machinery that sustained the slave trade ultimately exposed it, turning an insurance dispute into a catalyst for change.
Finally, Coyote Lawyers Up

t’s folly, really, trying to review a Looney Tunes movie like “Coyote vs. Acme” from an insurance perspective.
In the old cartoons, of course, Coyote would try to cleverly trap Road Runner, but the plans always backfired, leaving Coyote smashed, twisted or blown up. In the live-action/cartoon movie mashup released in August, Coyote sues Acme, the manufacturer of the various products — magnets, ball bearings, TNT — that foiled his plans. The product liability angle could not be clearer.
So, is this a movie about insurance?
Of course not! The Looney Tunes were cartoons. Granted, “Coyote vs. Acme” is a hybrid, mixing live actors and animated characters, but how much realism do you want? Do you want to see: Depositions? Fights over venue? Definitions of the word occurrence?
Or do you want to watch stuff blow up in the coyote’s face?
The movie’s inspiration — a 1,500-word New Yorker piece — took the concussive approach. Ian Frazier’s story is a simple opening statement from Coyote’s attorney. It is funny because it chokes the slapstick into a stentorian courtroom voice:
Yeah, 36 years to get to the screen.
Frazier wrote at the tail end of the liability crisis. Changes in case law had unleashed a crippling bout of social inflation. Only a few years earlier, insurers were so under-reserved that the whole industry could have been considered technically insolvent.
But this movie is not a nostalgia trip to the days when asbestos was the next asbestos. It’s nostalgia to when even before you could read or speak, you could divine Coyote’s plan (2-meter cannonball rolls off a valley cliff to flatten Road Runner) and watch it kerblooey (cannonball misses Road Runner, rolls up the opposite valley wall, flies in air and lands on Coyote).
On that score, “Coyote vs. Acme”does just fine. As Frazier told a roomful of cinephiles on August 30, 2026, in Montclair, New Jersey, the movie is a string of sight gags — just like the Chuck Jones originals.
Sure, there is a plot: Coyote finds a billboard attorney (Will Forte) and sues the evil corporation. And there are complications, like Coyote needs Road Runner as a corroborating witness but would rather have the bird under glass.
But the story exists mainly to link slapstick blackouts, with a couple other merry bits tossed in: The plaintiff lawyers are generally sad sacks who worry that the weekend mini-golf tourney might make them miss work Monday. Looney Tuners like Daffy, Bugs et al. land cameos. Tweety Bird, a spy for the defense, reprises his signature: “I tawt I taw …”
Acme’s fanatical lawyer (John Cena) blisters him:
“You tawt you taw? I don’t pay you to tink you taw. I pay you to taw!””
With all that, I tawt I taw some flaws. Some of the visual gags are complex, and the director doesn’t let them breathe so viewers can lock in the setup. A chase near the end involves rocket skates, some sort of motorcycle, exploding eggs fired from a bird-shaped gun, a refrigerator on the coyote’s back, and some more stuff — but too many for me to write down in a dark theater.
But the fun-to-tedium ratio, the moviemaker’s equivalent to signal-to-noise, is favorable. Sure, things drag late. The climax of the court case is not nearly the end of the movie, and the rest feels tacked on. And the ending scuttles the film’s subversive theme – that it is noble to persist even if you know you will never succeed.
But worrying about all that is like fretting about insurance as the theater lights dim. It gets in the way of the film’s goal — throw a lot of fun at the screen and hope some sticks.
From 10x to 3.2x: What a New Study Reveals About Social Inflation
asualty actuaries often discuss and are tasked with measuring social inflation. One complication is that a rise in observed verdicts may reflect a change in juror behavior, a change in the cases reaching trial, or some combination of the two. The paper, “Quantifying Social Inflation in Liability Insurance with Advanced Statistical Methods,” by Tsz Chai Fung, Liang Peng, Fang Yang, and Lie Ma, shows how significant that distinction can be. The authors’ unadjusted 2024 social inflation index is more than 10 times the 2009 level, but they show that holding factual case characteristics constant reduces it to about 3.2 times. For actuaries, this is the familiar problem of a changing mix of business.
Prior work, including Lynch and Moore’s study of commercial auto liability, has found liability loss growth beyond standard economic indicators. In litigation data, however, the observed trend may also change with the mix of injury types and severities, jurisdictions, causes of action, parties, defendants, and reported insurance involvement. A year with more wrongful-death cases or serious injuries can produce larger verdicts even if comparable cases are being decided no differently than before.
The paper addresses this problem using a framework that can be stated in actuarial terms:
- Convert verdicts and settlements to constant dollars.
- Examine plaintiff win probability, settlement probability and payment severity separately rather than forcing everything into a single trend.
- Estimate the change over time while holding observable case characteristics constant.
- Compare the raw result with a case-mix-adjusted result and a further adjustment for litigation-strategy variables, with uncertainty ranges around each estimate.
The authors apply the framework to 74,188 reported litigated matters in VerdictSearch from 2009 through 2024. The data span motor vehicle, general liability, professional liability, and other cases, although those groupings are proxies rather than statutory lines of business. Logistic regression is used for plaintiff win and settlement probabilities. Quantile regression is used for verdict and settlement amounts, which keeps a few enormous awards from driving the results. Rolling multiyear windows help with the declining annual case counts, and a weighted bootstrap provides confidence intervals.
For the paper’s 75th-percentile measure of total plaintiff payments across observed cases, the raw 2024 index stood at just over 10 times its 2009 level, after removing ordinary economic inflation. Holding factual case characteristics constant reduces that figure to about 3.2 times the 2009 level. Holding litigation-strategy variables constant as well reduces it to about 2.3 times.
Some of that difference reflects the body of cases available for analysis, but some changes in case mix can themselves be indicative of real social inflation. The cases observed in the database became more severe and complex on average, with more injuries, attorneys, and experts. The authors discuss declining case counts, the selection of more severe disputes into litigation, and possible changes in reporting. Without adjustment, the resulting change in average case characteristics is counted as social inflation. There is a wrinkle, however. If changes in the litigation environment make it more likely that large or complex claims are pursued, part of what the model treats as case mix could reasonably be viewed as social inflation. The authors’ separate results for factual and strategic variables make that a useful question for further research.
Much of the apparent increase in verdict severity before 2020 goes away after controlling for case mix. The increase after 2020 does not. It remains large and statistically significant even after factual and strategic variables are included. To me, this is a more credible result than the tenfold increase suggested by the raw data.
The authors treat the result adjusted for factual case characteristics as their main measure of social inflation. They also show what happens when trial length and attorney or expert involvement are held constant. Those variables may reflect changes in litigation strategy, but litigation strategy may itself contribute to social inflation. The additional adjustment is therefore useful for assessing that contribution but is not necessarily a better estimate of the underlying trend.
The channel-by-channel results are also informative:
- Plaintiff win probability among cases reaching verdict increased.
- Settlement probability among the recorded litigated cases declined.
- Settlement severity showed relatively little statistically significant inflation after adjustment.
- Verdict severity, particularly after 2020, was the main source of the increase in plaintiff payments.
- Higher points in the severity distribution did not appear to be inflating systematically faster than moderate awards after case-mix adjustment.
The last finding cuts against the common tendency to equate social inflation with nuclear verdicts. The results suggest a broader increase in verdict severity rather than a trend confined to a few spectacular awards. Nuclear verdicts still matter greatly to excess insurers and reinsurers, but counting verdicts above a fixed threshold gives an incomplete picture.
Before treating these estimates as actuarial trend assumptions, an actuary has to account for three gaps in the data:
- Selection and representativeness: VerdictSearch records come from attorney submissions and reporting by ALM editors and reporters. They cover reported litigated matters, not the broader population of liability claims, most of which never reach a verdict. Annual case counts decline sharply, especially after 2020. The models cannot adjust for cases that never enter the database, unobserved characteristics of the cases that do enter it, or unrecorded changes in the reporting process.
- Insurance terms: The data show ground-up verdicts and settlements, not amounts ultimately paid by insurers. Policy limits, deductibles, self-insured retentions, and reinsurance structures are not available.
- Exposure: Plaintiff win probability is conditional on a case reaching verdict. It is not claim frequency per exposure.
For practitioners, the 3.2-times index is not a loss trend or LDF assumption. It describes ground-up outcomes in reported litigated cases. A practical application would be to examine internal data separately for claims reaching verdict, claims settling and payment severity; control for shifts in the mix of claims; and then consider how limits, retentions and reporting patterns affect insurer-paid results. Used that way, the paper gives actuaries a better starting point for measuring social inflation and a clearer sense of what the available litigation data can support.

Actuarial Science in the Wild: Risk Models in Everyday Life
here is a point in an actuary’s career when ordinary life begins to look different.
A few months ago, I found myself driving behind an old, visibly beat-up car that was weaving somewhat precariously through traffic. My immediate reaction was probably the same as anyone else’s: That tracks.
The car’s abused appearance showed some unfavorable historical loss experience, and the driver was currently providing fresh evidence consistent with it — but then I started thinking about the less convenient cases.
Suppose the car had been immaculate, yet the driver was swerving wildly. Would I revise my view of the risk despite the apparent absence of prior damage or losses? Conversely, suppose the car was dented and battered, but I watched its driver behave impeccably for miles. How much weight should I give the unfavorable history relative to what I was observing now? That tension is increasingly familiar in P&C practice. In modern P&C pricing and experience rating, actuaries must decide how historical loss experience should be weighed against new behavioral or predictive information.
At that point, an absent-minded observation of an ordinary defensive-driving decision I encountered had suddenly become an experience rating problem.
There is a distinctly Bayesian flavor to the question. We begin with some belief about an underlying, unobserved level of risk and update it as new evidence arrives. Possibilities that make the observed evidence more likely receive more weight in the posterior distribution; possibilities that explain it poorly receive less.
Traditional experience rating in commercial insurance approaches the same general problem from a different direction. Under a Bühlmann credibility framework, we do not need to specify a full prior distribution and likelihood. Instead, the weight placed on an individual risk’s experience depends on the relationship between expected process variance (“EPV”, how much observed loss experience can vary around a risk’s own expected level) and the variance of hypothetical means (“VHM”, how much the underlying expected loss level varies across risks).
So agreement or disagreement between past experience and new information is not itself the answer. The deeper question is how informative each source is about prospective risk.
Believe it or not, pay enough attention to your everyday life and actuarial questions like this begin to emerge almost on their own.
Waiting for Mickey to take care of business
Anyone who owns a dog knows that some walks are really just a waiting game for nature’s call. Mickey, however, operates according to his own schedule. Five minutes may pass. Then ten. Eventually I find myself wondering: what is the probability that he will have taken care of his business by a particular point in the walk? That is, of course, a time-to-event problem.
If T represents the amount of time until the event occurs, then I can think about the probability that T is less than ten minutes, fifteen minutes, or twenty. After enough uneventful time, the more relevant question becomes conditional: given that nothing has happened yet, what is the probability that the event will occur in the next few minutes?
At that point, I have wandered into survival analysis and hazard rates.
Mickey remains unaware of any of this.
The P&C analogue is straightforward. Claims are reported after varying lags. Payments emerge over time. Claims close at different rates. At any valuation date, we observe part of the process and infer what remains unseen.
The same reasoning applies to actuarial models of claim settlement times. Does a claim that has remained open for six months become more or less likely to settle in the next thirty days? The answer depends on the distribution of settlement times, which may vary by claim type, severity, litigation status, and other characteristics. Survival analysis, using approaches such as Cox proportional hazards models or GLMs, can help actuaries identify these patterns and project future claim closures and payments.
A dog walk and an insurance claim settlement are obviously not the same problem. But both illustrate a fundamental idea in survival analysis: the longer we’ve waited for an event, the more informative that waiting time may become. For a memoryless distribution, such as the exponential, waiting longer tells us nothing about how much longer we’ll have to wait. For other distributions, the likelihood of an event occurring soon may increase or decrease with elapsed time. Understanding these relationships helps actuaries better predict claim settlement patterns and assess uncertainty in outstanding liabilities.
Ratemaking for rotten lettuce
This led me to wonder what would happen if I treated household food spoilage as a miniature self-insured loss program.
The actuarial structure is there. There is a frequency component: How often do I lose food to spoilage? There is a severity component: How much does each event cost? Given enough observations, I could construct an aggregate monthly loss distribution, estimate an expected loss cost, and contribute a corresponding amount into a dedicated fund.
Naturally, however, an expected value alone would not be enough.
Suppose I wanted the fund to remain adequate in 95% of months. I would need to consider the variability of aggregate spoilage losses and determine how much additional surplus or contingency funding was necessary above the mean. A particularly unfortunate month involving produce, leftovers, dairy products, and some poorly planned bulk purchase could generate what might reasonably qualify, by refrigeration standards, as adverse development.
The analogy begins to look suspiciously like reserve and capital adequacy.
The expected monthly spoilage cost is analogous to an expected loss provision. The additional money needed to absorb unfavorable variation plays a role similar to risk capital. If actual spoilage consistently exceeds expectations, I would eventually need to revisit my assumptions, contribution rate, or underwriting practices.
In this particular program, “underwriting practices” would mostly consist of meal planning and remembering what is already in the refrigerator — unless I decided to get more sophisticated with inventory apps, smart appliances, or other household IoT.
The endless traffic lights of Sixth Street
Somewhere along the route, usually while sitting at one of them, I would begin thinking about the total amount of time I spent waiting at red lights — and perhaps more importantly from a lateness-risk management perspective — what the tail of that distribution might look like on one of those especially unfortunate mornings.
Suppose the waiting time at each traffic signal was a random variable. In a highly simplified version of the problem, assume the waiting times are independent and identically distributed, each with mean μ and variance σ2.
If I encountered enough lights, the central limit theorem would suggest that total waiting time could be approximated by a normal distribution, with mean nμ and variance nσ2. It is a pleasant little model.
Unfortunately, traffic signals do not generally behave like identically distributed, independent draws from the same process.
Traffic lights may be synchronized. Catching one red light can affect the probability of catching the next. Congestion changes arrival times at downstream intersections. Different signals have different cycle lengths. The covariance terms therefore matter.
For total waiting time T,
Var(T) = ∑i Var(Xi) + 2∑i<j Cov(Xi, Xj).
Here, Xi and Xj represent waiting times at different traffic lights. The covariance terms capture dependence between pairs of lights, and together they form the off-diagonal elements of a covariance matrix for the entire route.
The broader point is familiar to P&C actuaries: Aggregate variability depends not only on the volatility of individual components, but also on how those components move together.
That same issue becomes far more consequential in catastrophe modeling. Individual insured locations may each have manageable expected losses, but a hurricane, wildfire, or earthquake can create losses across thousands of risks simultaneously. Treating those exposures as independent would badly misstate the distribution of aggregate loss.
A way of looking at uncertainty
That is partly the point.
Actuarial science is often described through its technical machinery: probability distributions, credibility theory, reserving methods, generalized linear models, simulation, capital models, and increasingly, machine learning. All of those tools matter. But beneath them lies something more basic: a way of looking at uncertain events.
What information do we have? How credible is it? What remains unobserved? What distribution might plausibly describe the outcomes? What happens when risks are combined? How should our estimate change when new information arrives?
Those questions appear constantly in insurance. They also appear, perhaps more often than we notice, in everyday life.
I recently explored a version of this question in a presentation I delivered at the joint CAS/AICT seminar in Taipei, “Modernizing Experience Rating: Credibility, AI, and Regulatory Trust.” The underlying issue was much the same: How should traditional loss experience be combined with increasingly rich behavioral and predictive information when estimating prospective risk?
That brings me back to the story of the driver in the opening segment.
Traditional experience rating asks us to learn about a risk partly from what has happened to that risk before. Today, telematics can measure acceleration, braking, speed, cornering, and mileage. Cameras and other sensors can observe circumstances that previously disappeared as soon as they occurred. AI systems can interpret streams of behavioral information on a scale no human observer could approach. In a sense, technology is beginning to do systematically what I was doing informally behind that battered car — observe behavior and ask what it tells us about prospective risk.
One can imagine, in effect, an automated version of me sitting behind every insured vehicle — minus, presumably, the commentary.
That creates enormous opportunities, but it also returns us to the original question. Suppose historical loss experience suggests one thing, and current behavioral information suggests another. How much weight should each receive? How credible is the observed experience? How reliable is the model interpreting the new signal? Is the signal genuinely predictive, or merely correlated with something else?
The technology may be new. The underlying actuarial problem is not.
For practicing actuaries, that suggests a simple discipline: When historical experience and a new predictive signal point in different directions, make the tradeoff explicit. Ask how credible each source is, what evidence supports the new signal, and how much the resulting estimate would change if either source were given more or less weight.
Together, these examples illustrate one of the most appealing things about actuarial science. Its principles are not confined to insurance textbooks, spreadsheets, or sophisticated models. These principles are ways of reasoning with incomplete information and uncertain futures. Once you become accustomed to thinking that way, the same questions begin to appear in traffic, in household expenses, on a walk with the dog — whether you were looking for them or not.
Hundreds of Silica Lawsuits and Counting: Is P&C Heading Toward Another Asbestos Crisis?
ctuaries in the 1980s could be spooked by simply saying the word “asbestos.” Once thought to be a home builder’s dream in the 20th century, decades later, asbestos would become the insurance industry’s worst nightmare, with exposure to it being linked to mesothelioma, an aggressive form of cancer. The resulting commercial general liability and products liability claims rewrote how actuaries reserved not only for primary insurers but also for reinsurers who were caught unaware by the latency of these long-tailed claims. The estimated total industry losses for asbestos were around $100 billion in ultimate net losses, with combined ratios at the time exceeding 115% and threatening to bankrupt even Lloyd’s of London (AM Best).
Today, the industry has created a standardized framework to understand and manage asbestos liabilities. However, the modern age brings with it silica claims that could shape up to be the TikTok-era equivalent of the asbestos crisis. There are few, if any, current estimates regarding the size of insurance industry exposure to silica-related claims. OSHA estimated in 2014 that 2.3 million people in the U.S. were currently exposed to silica at work, sharing the same broad order of magnitude with the 1.3 million estimated by the CDC to still be exposed to asbestos at that time. Much like asbestos-induced mesothelioma, inhaling toxic crystalline silica causes an incurable lung condition in young individuals called silicosis. With silica lawsuits already popping up in California, this raises the question: should silica claims be treated with as much fear as asbestos claims?
What is silica and silicosis?
While engineered stone RCS levels were not widely recognized as an insurability problem until the late 2010s in the U.S., the CDC’s published report on outbreaks in 2019 brought public awareness to the issue (National Institute for Occupational Safety and Health). Young workers in their 20s and 30s started to seek litigation to help pay for their care and lifelong support. This battle also brought about a different problem: Who was responsible for the sick workers? Was it the manufacturer of the engineered stone slabs? Was it the big retailers who sold these slabs to the general population? Or was it the subcontractors who actually employed these workers? Would these workers’ claims be covered by workers compensation policies or commercial general liability policies?
Where does the responsibility lie?
In this complex web of whodunit, multiple parties could be held responsible, making it difficult for their insurers to remain fully prepared ahead of time.
So where does insurance come into play?
However, insurers today have learned from their past experiences. The early 2000s saw a wave of sandblasting silica claims, spooking many insurance companies into explicitly including silica exceptions into their policies (RNC-Pro). Generally, this exclusion is supposed to be a catch-all to avoid the exact scenario of insurers being on the hook for silicosis claims. Retailers and manufacturers, too, are smarter, employing large legal teams to find loopholes in the exclusions. They claim that the exclusion covers “silica dust,” a natural mineral, while the dust inhaled by the workers is a highly toxic combination of not just silica, but other chemical components. Using the “Concurrent Causation Doctrine,” these litigation teams may claim that the policies must provide coverage, potentially bypassing the silica exclusion (Alafriz). Lawyers could also use the “Duty to Defend” precedent set under California courts, claiming that even the potential of indemnity under the policy could require an insurer to defend its insured in court (Montrose Chemical Corp. v. Superior Court).
If a primary insurer’s defenses don’t hold in court, the scale of silica verdicts will inevitably drag reinsurers into the picture. If a court holds insurers responsible for payment, reinsurers may also remain on the hook to uphold their treaties, potentially shouldering a large share of the verdict burden depending on the precise terms. To protect their interests, global reinsurers are sounding the alarm to include ironclad silica exclusions in their treaties, forcing primary insurers to absorb the multimillion-dollar verdicts within their net retention if they don’t follow suit. However, these exclusions are a more recent development, still leaving reinsurers exposed to historic treaties that included weaker silica exclusions.
Lawsuits, lawsuits everywhere
While only five trials have concluded, the number of silica lawsuits are expected to ramp up over the next several years. With juries seeming to side with the plaintiffs, it could only be a matter of time until several more lawsuits are filed, causing the manufacturers and retailers to fight harder for insurance to cover these verdicts.
What now?
However, not all is lost. As the industry did in the past with asbestos, it not only has the time to manage future exposure, but there is also a large coverage opportunity in the market that could be filled. First, insurers should immediately consider tightening their policy definitions, if this has not been done already, using stricter definitions for engineered stone quartz and RCS. To make their policy exclusions for silica claims more robust, carriers may incorporate not only natural silica, but all the toxic chemicals that are released in the process of grinding these quartz countertop slabs.
For carriers that are willing to underwrite silica risk, their strategy may include incorporating strict sub-limits for silica exposure or providing coverage on a claims-made basis. This would help them deal with the high severity and latency of such claims. By updating their policy language and underwriting guidelines, insurers and reinsurers can adequately handle the silica problem instead of letting it balloon into the next great industry crisis.
- AR was unable to independently identify the underlying litigation dataset supporting that count as of publication
Works Cited
Alafriz, Olivia. “Artificial Stone Silica Suits Set Up Insurance Coverage Fights.” Bloomberg Law, 21 October 2025, https://news.bloomberglaw.com/insurance/artificial-stone-silica-suits-set-up-insurance-coverage-fights. Accessed 16 September 2026.
AM Best. “Best’s Special Report: Asbestos & Environmental Reserves Decline Along with Incurred Losses.” AM Best, 19 November 2024, news.ambest.com/pr/PressContent.aspx?refnum=35428&altsrc=2. Accessed 18 September 2026.
American Law Institute. Restatement of the Law Third, Torts: Products Liability. Sec. 5. American Law Institute Publishers, 1998.
California Public Law. “Labor Code section 3602.” https://california.public.law/, 1 January 2013, https://california.public.law/codes/labor_code_section_3602. Accessed 16 September 2026.
Freedonia Group. “US Engineered Stone Countertops.” https://www.freedoniagroup.com/, 2022, https://www.freedoniagroup.com/industry-study/engineered-stone-countertops-4395.htm#. Accessed 16 September 2026.
Gounder, Céline. “As Lung Disease Threatens Workers, Lawmakers Seek Protections for Countertop Manufacturers.” https://kffhealthnews.org/, 12 March 2026, https://kffhealthnews.org/public-health/quartz-countertops-silicosis-workers-lung-disease-crystalline-silica/. Accessed 16 September 2026.
Hooker v. Department of Transportation. 27 Cal. 4th 198. Supreme Court of California. 2002.
Merck Manuals. “Silicosis.” https://www.merckmanuals.com/, 2023, https://www.merckmanuals.com/professional/pulmonary-disorders/environmental-and-occupational-pulmonary-diseases/silicosis. Accessed 16 September 2026.
Montrose Chemical Corp. v. Superior Court. 6 Cal. 4th 287. Supreme Court of California. 1993.
Morbidity and Mortality Weekly Report. “Malignant Mesothelioma Mortality — United States, 1999—2005.” cdc.gov, 24 April 2009, https://www.cdc.gov/mmwr/preview/mmwrhtml/mm5815a3.htm. Accessed 19 September 2026.
National Institute for Occupational Safety and Health. “Outbreak of Silicosis among Engineered Stone Countertop Workers in Four States.” https://www.cdc.gov/, 29 October 2019, https://www.cdc.gov/niosh/bulletin/2019/silicosis-countertop.html. Accessed 16 September 2026.
Occupational Safety and Health Administration. “OSHA Fact Sheet, Workers' Exposure to Respirable Crystalline Silica: Final Rule Overview.” osha.gov, March 2016, https://www.osha.gov/Publications/OSHA3683.pdf.
Privette v. Superior Court. 5 Cal. 4th 689. Supreme Court of California. 1993.
RNC-Pro. “CU 21 50-Silica Or Silica-Related Dust Exclusion.” https://www.rnc-pro.com/, April 2022, https://www.rnc-pro.com/rnc-pro/pfm/200/275_0604.HTM. Accessed 16 September 2026.
Silicosis Lawsuit. “Litigation tracker: engineered-stone silicosis cases with a public outcome.” https://silicosislawsuit.com/, 12 September 2026, https://silicosislawsuit.com/litigation/cases/#. Accessed 16 September 2026.
Stone Update. “Calif. Jury Awards $47 Million in Silicosis Case.” 6 August 2026, www.stoneupdate.com/calif-jury-awards-47-million-in-silicosis-case/. Accessed 18 September 2026.
Webb v. Special Electric Co., Inc. 63 Cal. 4th 167. Supreme Court of California. 2016.
Reserve Acceleration with Agentic AI
his author saw a lot of sessions, pitches, and deep dives on reserving, technical acumen, AI approaches, and workflow efficiencies in Las Vegas at the 2026 Casualty Loss Reserve Seminar.
They might all be summed up in a best-of-breed session titled “Reserve Acceleration with Agentic AI” by a KPMG team and an active client at Root Insurance.
Jeremy Smith, FCAS, told the audience that many steps of progress and pilots are ongoing at Root Insurance with KPMG, with several illustrations of advancing machine learning models into agentic AI-accelerated workflows across the Root claims organization.
Some examples were text analytic-supported feature extraction and predictive modeling of high-value claims problems like litigation, reinsurance recovery, attorney involvement, suspicion of fraud, and payment integrity.
These agentic workflow capabilities have also been turned into key supporting activities in claims, including loss reserving.
He introduced the technical environment as Copilot along with Databricks and then foreshadowed that much of the current best progress in generating value for clients is where teams are using agentic AI that is enabling machine learning (ML), that is, ML masquerading as AI; they now see a ten-times faster time to accelerate data science in claims into reserves, yet caution that there is still an actuary-in-the-loop requirement.
While general-purpose AI capabilities for extracting data, making structured from unstructured data, and ingesting loss run data are largely table stakes for many steps now, the ability to support a full spectrum of end-to-end reserving is still more of an ambition than ready for production in this engagement. The current progress in the engagement for reserving was reported as mostly expanding the amount of data, toolkits, and processes that can be combined into the tight timeframes surrounding making a reserving call, but AI is not ready to be a reserving actuary here yet.
The speakers that followed filled in all the pieces to make this one of the best sessions at CLRS, showcasing that going a lot faster with agentic AI is feasible, yet the need to be making correct decisions and using actuarial judgment is still ultimately very essential and still a step that requires people with actuarial training.
Micah Ruth from Root Insurance discussed the progression of AI capabilities and how changes in technology are creating innovation opportunities that are being applied in claims processes.
Ruth shared that many steps in customer interaction can be supported with classical AI –and it fits in its own lane supported by scripts. Generative AI needs more authority on what is returned to a user, so it’s better for it to support functions like summary statements and abstracting bullet points from pages of text and mounds of unstructured data.
Ruth pointed to use cases where agentic AI can be more autonomous and deal with complexity itself. She concluded with an example of payment integrity where a multi-agent system has been created targeting identity fraud challenges and two AI agents communicate to understand the risk of fraud before issuing payments. The speed and scale of the multi-agent task exceeds anything a person could do.
Nate Loughin, ACAS, of KPMG discussed how large language models and AI agents can accelerate knowledge-based tasks, particularly by retaining and summarizing lengthy conversations and complex information. However, he cautioned that AI can still generate inaccurate or fabricated information, especially when tackling the technical complexities and professional judgment required in reserving.
Smith observed that there was a bit of humor in the fact that in the real world, the senior and junior staff find the technology intriguing and satisfying, while those actually doing the reserving work in the middle are getting stuck dealing with identifying and resolving any AI-generated hallucinations. So, for reserving itself, they are still skeptical of using AI for decision-making, but they definitely see an acceleration of the work process that gives them more time to think the hard thoughts on making accurate and defensible reserve judgments. It was also noted that AI makes it much easier to try to incorporate more data and even outside tools and trends.
Ruth emphasized that proper governance leads to trust, and she noted that each company needs to bring its own values into incorporating AI into its processes. She noted that at her company there is a culture of being “values led,” which means fairness first over bias potential of an AI that may try to be cheaper or faster. At any juncture, her challenge for AI is to make being trustworthy a priority, or WWAHD — what would a human do?
Sophia Song, FCAS, summarized the state of the industry for AI. She noted that personal lines are ahead of commercial lines, but there is a larger opportunity in commercial for the strongest parts of current AI capabilities with the hundreds of pages of facts and forms typical in commercial insurance. She laid out the case for humans getting better faster using visualization powered by AI, as well as change-detection alerting for everything from filings to data trends to emerging claims risks.
To illustrate how agentic AI is reshaping reserving, Song introduced the “Accelerate, Elevate, and Scale” framework, demonstrating how AI can complete initial analyses in a fraction of the time required by humans, freeing actuaries to focus on professional judgment, deeper insights, and creating value for the business.
Loughin did a demo of the various applications in predictive analytic workflows before showing the current reserving uses. A big feature was how the AI process generated code that can be applied on a go forward basis and shared as knowledge across the organization. Additionally, the demonstration showed that AI can accelerate most efforts getting data in shape and generating analyses. Nonetheless, the study concluded that it favors humans over robots when it comes to picking a peg loss ratio.
Loughin showed a multi-agent opportunity by breaking agentic responsibility apart — orchestrated agent work can be task-specific, like in reinsurance recovery, to pull and read bordereaux documents, to read claims, review demand packages, and plan strategies for claims outcomes.
A brief Q&A session hit on the importance of governance, the need for better data, the concerns over reproducibility issues of generative technology, and concluded with a large round of applause.
Catastrophe Modeling’s Evolution in a Changing World
ear after year, natural catastrophes that happen—or don’t—confound us. Several recent examples highlight the unpredictability of these events. For example, as of only eight months into 2026, both the number of fires and acres burned had already exceeded the 10-year average, according to the National Interagency Fire Center.1 Yet in 2025, no hurricanes made landfall in the U.S.—the first time since 2015. Climate uncertainty and volatility seem to be rewriting the rules of property insurance.
The Louisiana property insurance market is a prime example. During the 2020 and 2021 hurricane seasons, the state was pummeled by an unprecedented four major hurricanes. Homeowner’s insurance combined ratios exceeded 400% and triggered twelve carrier insolvencies over the following two years. This left many policyholders to the state’s insurer of last resort.2
Financial strain from catastrophes is being felt across the P&C insurance industry. Between 2015 and 2019, catastrophe losses contributed approximately 6.8% of the combined ratio on average. That same average percentage was closer to 12% in the period from 2020 to 2024.3 As the proportion of losses attributable to catastrophes grows, the importance of accurately pricing for these events only intensifies.
Traditional ratemaking relies on past loss experience to predict future loss experience. By relying on historical premiums and losses, actuaries can effectively price high-frequency, low-severity lines like personal automobile insurance. However, this retrospective approach misses the mark when applied to low-frequency, high-severity perils like hurricanes and wildfires. The rare nature of these extreme events means five, ten, or even 100 years of data may lack an ample amount of signal to reliably estimate future losses.
To address the gap of data for these rarer events, the industry turned to a forward-looking approach with catastrophe (CAT) modeling. Pioneered in 1987 when Karen Clark founded Applied Insurance Research (AIR), CAT modeling blends meteorology, seismology, structural engineering, and actuarial science to generate hundreds of thousands of plausible future scenarios. While early natural disaster simulations were developed in the mid-1900s, they were not adopted by insurance companies until decades later due to a perceived lack of necessity and technological limitations.
The shift in strategy came once Hurricane Andrew, a Category 5 storm, hit Florida in 1992. Howard Kunst, FCAS, MAAA, CCRMP, and chief actuary at Cotality, recalls that day: “When Hurricane Andrew hit, it was an event of proportions that nobody could ever have imagined was going to happen.” Causing around $15.5 billion in insured losses in 1992 dollars4 and leading to insolvency of at least sixteen insurance companies, the storm proved that only using historical data is insufficient for extreme right-tailed risk. Prior to Andrew, the largest insured loss from a hurricane was $4 billion when 1989 Hurricane Hugo hit South Carolina. While many traditional reinsurers estimated Andrew’s losses would not exceed $6 billion, Clark’s AIR model projected a $13 billion loss, validating the technology overnight. Thus, CAT models shifted from being a niche idea into a necessity for managing future catastrophic losses.
Modern CAT models do not generate a singular, absolute truth. Instead, proprietary CAT modeling technology vendors utilize a variety of data inputs and differing methodologies to provide platforms that insurers can run against their specific book of business. Some insurers create these models in-house. Despite differences in how these models are formed and what data goes into them, virtually all modern CAT models rely on four distinct modules: hazard, exposure/inventory, vulnerability, and financial/loss. (See Figure 1)
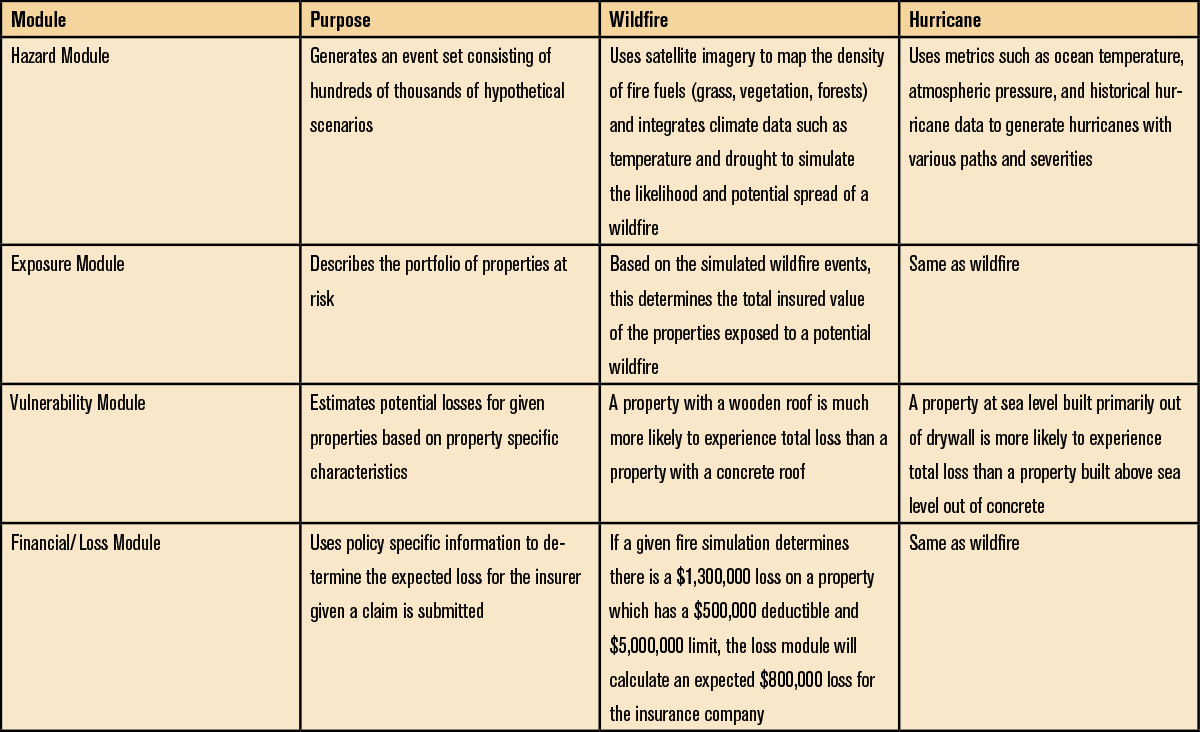
Peril-specific insights
Wildfires
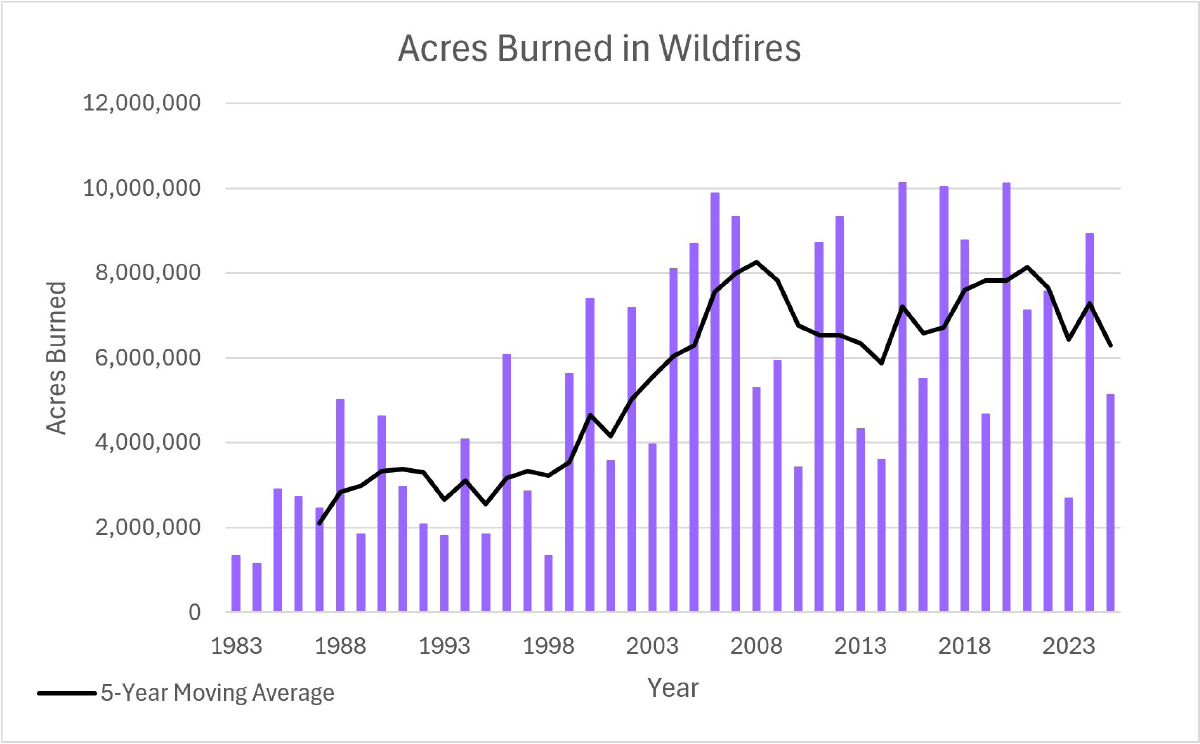
Can we therefore assume the increase in wildfires is due to global warming? We cannot make that conclusion as neatly as one might expect. One of the most difficult challenges of analyzing the effects of climate change on catastrophes is the inability to conduct a controlled experiment. There are multiple factors alongside climate that could affect wildfire frequency and severity. Infrastructure changes, like new roads, for example, could impact a fire’s ability to spread. Even legislative changes such as firework regulations and forestry management could alter the number of wildfires.
An increase in the population of the Pacific Northwest in recent years has also increased the risk of wildfire ignition. As studies have shown, 85%-90% of wildfires are estimated to be caused by humans. The increase in suburban sprawl results in more people moving into wildland-urban interfaces (WUI)—zones of land where human development meets undeveloped wildland vegetation—and are a hotbed for wildfire activity. Many of the most catastrophic wildfires in the last decade were WUI wildfires, including the 2018 Camp Fire in Paradise, California, and the 2023 Maui Wildfires in Hawaii.
In a machine-learning analysis6 of five major California WUI wildfires—2017 Tubbs, 2017 Thomas, 2018 Camp, 2019 Kincade, and 2020 Glass Fires—researchers found distance between structures (SSD) to be the most important determinant of structure survivability. The remaining significant predictors underscore the “importance of hardening structures, structure density, and building arrangements in WUI areas to mitigate fire risk and potential destruction.” The results from this study support the strong focus placed on accounting for mitigation efforts in wildfire CAT models, at the individual property owner as well as at the community and state level. (See Figure 3.)
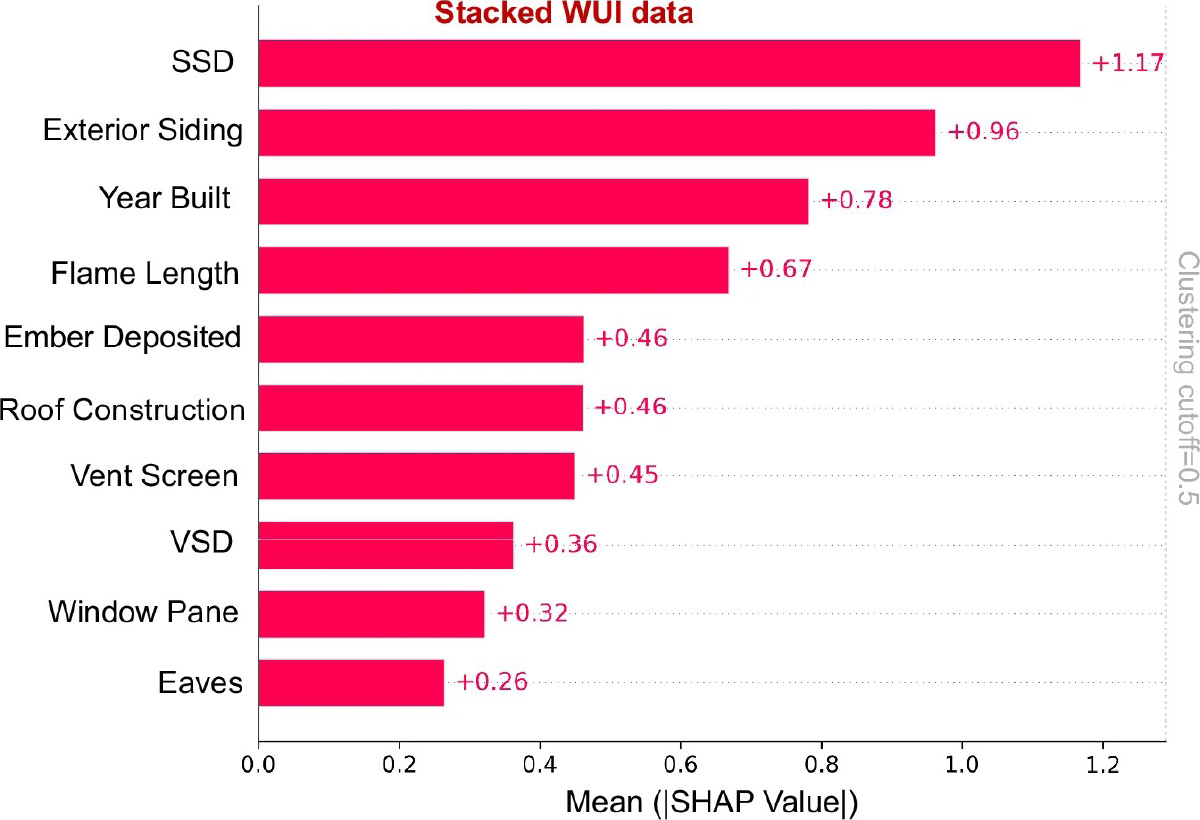
Hurricanes
Moreover, according to the NOAA, “On the century time scale (e.g., since 1900), there has been no significant trend in annual numbers of U.S. landfalling tropical storms, hurricanes, or major hurricanes.” (See Figure 4.)
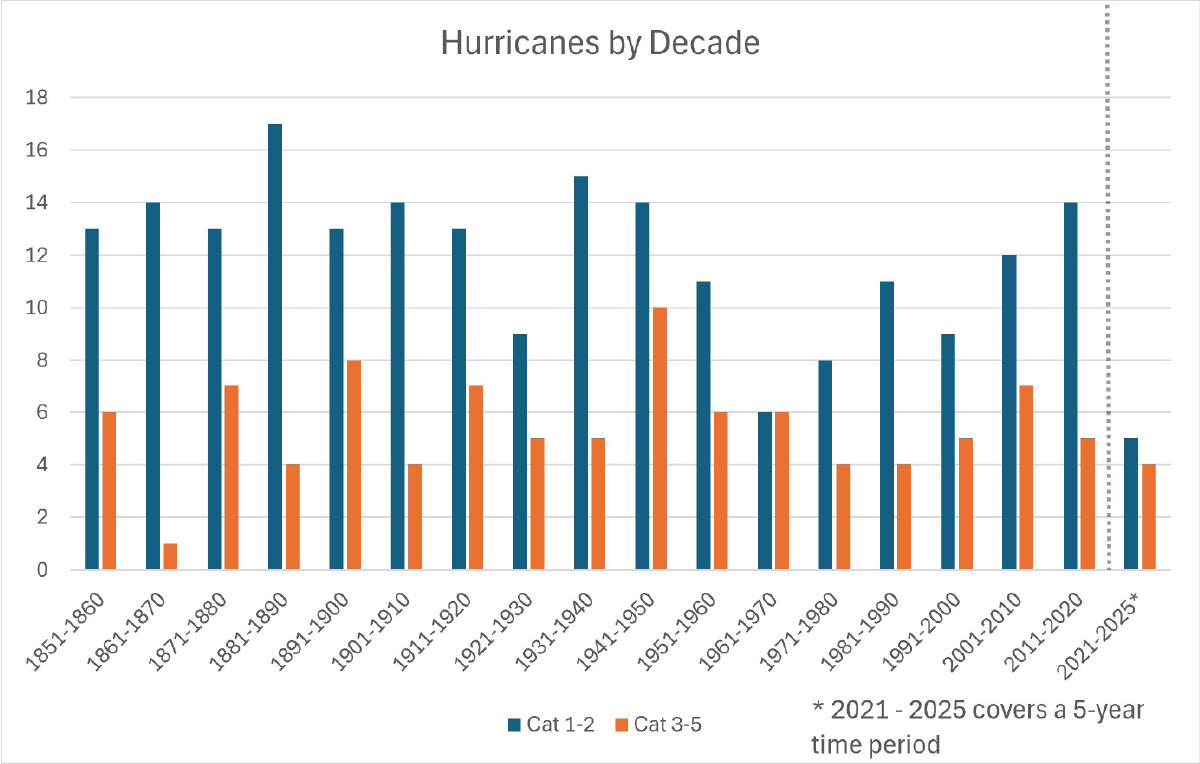
How do actuaries make sense of these conflicting data points? Despite science suggesting that hurricanes should be increasing in intensity (i.e. seeing more Cat 3-5 storms than Cat 1-2 storms) the data show no significant increase over the last 170 years. According to Kunst, “there is definitely debate among actuaries, but most people believe there should be some degree of increase in hurricane severity.”
On the surface, that set of 170 years of hurricane data may seem sufficient to identify trends. There have only been approximately 300 hurricanes to make landfall during this time, however, so it is reasonable to believe there is a trend that hasn’t had enough time to present itself in the data yet. Jamie Rodney, the CEO of Reask, believed as much, and decided to simulate an increase in hurricane frequency to determine how apparent a true increase in frequency would be visible in the data.8 Using a Poisson model in which hurricane frequency increases from 2 to 2.4 events per year over a 50-year period, 20% of simulations were unable to detect a positive trend after 80 years. Therefore, even a large (20%) increase in hurricane frequency over a relatively short (50 years) period of time will often not present itself in the data until many decades later.
As examples show that historical experience is not likely a reliable basis for CAT models, the insurance industry is adapting its models for current and future risks to better price policies and set reserves with greater confidence. This is important from an individual lens as insurers can realize more profit. It is also crucial on a larger scale. Better risk prediction means companies may refrain from finding service areas uninsurable, leaving markets entirely similar to insurers’ exodus after the California wildfires.
If insurers do leave a market, however, they may still be aware of potential risks and therefore able to provide better aid to insurers of last resort (ILRs). Since ILRs are legally required to stay in an particular area, if they have insufficient funds to pay claims, insurers may be assessed to make up the difference to settle claims. Understanding potential risks helps insurers prepare in the event that they need to make emergency aid decisions.
Climate-conditioned models
In addition to RCPs, Global Climate Models (GCMs)10 provide a more physics-based approach to simulated data. They learn from physical processes such as wind, pressure, flooding, and temperature to solve equations surrounding fluid dynamics or heat dispersion. A GCM consists of four main climate components:11
- The atmospheric component, simulating the transport of heat and water around the globe.
- The land surface component, simulating surface characteristics like vegetation and snow cover.
- The ocean component, simulating the current movement of the ocean, which is the dominant reservoir of heat and carbon in the climate system.
- The sea ice component, simulating solar radiation absorption and air-sea heat and water exchanges.
Outputs from these components can be factored into newer models along with RCP data, such as in the form of a “climate module.” In the hypothetical climate module, diagnostic and prognostic metrics can be utilized in addition to the four aforementioned climate components. Diagnostic metrics include detecting statistically significant changes and then attributing how much of that change is due to unnatural causes. Prognostic metrics would help predict future climate, such as global warming trends, validated by hindcasts of 20th century climate change.
However, due to their complexity, GCMs require an enormous amount of computational power, requiring technological workarounds to make them feasible. Another issue with GCMs is that they struggle to provide granular data. They excel at predicting continents and regions, but cannot narrow their scope without significant tradeoffs. To address that shortcoming, different machine learning (ML) algorithms can scale GCM data down to precise levels, with some preliminary methods being quite attractive; however, these occasionally “smooth over” minor exposures and still require fine-tuning.
AI integration
One way AI is revolutionizing current processes is through damage assessment after CAT events. In the past, on-the-ground teams were deployed to survey damaged areas, which was a slow and potentially hazardous process. Now, satellite-based AI classification, illustrated in the Moody’s example below,12 can scan designated areas and rapidly detect and estimate structural damage. (See Figure 5.)
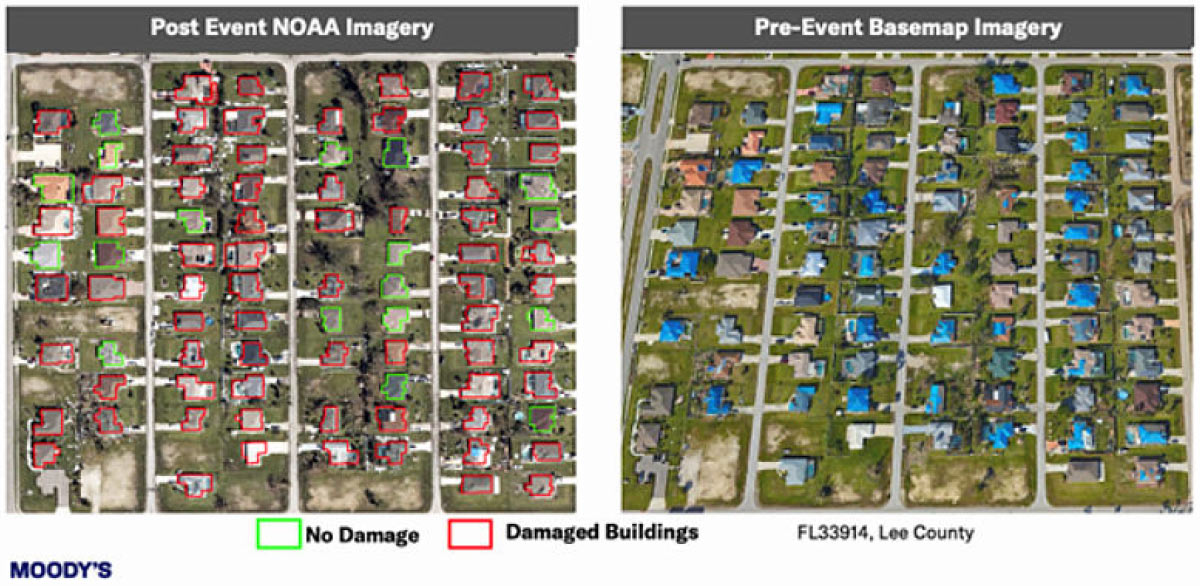
Despite the time and efficiency gains from the use of AI, it’s important to keep in mind the limitations and flaws of its use. Hallucinations can happen and go undetected, especially with a complex process like CAT modeling. Model output and events generated may seem reasonable on the surface, but break the laws of physics upon closer inspection. Additionally, AI methods aren’t designed to be fully reliable for edge cases—and as CAT modeling’s main focus is on extreme low-frequency, high-severity events, AI may fall short.
Conclusion
The evolution will require navigating complex variables because, while it’s simple to map a clear statistical trend for perils like wildfires, isolating the impact of climate change from human factors is not. Actuaries must reconcile instances in which science and historical data seemingly conflict, like navigating a sparse hurricane dataset that has yet to reflect increased hurricane severity from rising ocean temperatures. Ultimately, advanced predictive tools are not just technical upgrades. Achieving more accurate risk pricing allows insurance companies to maintain solvency and confidently serve insureds in volatile regions, rather than exit difficult markets entirely.
- https://www.axios.com/2026/08/03/us-wildfire-season-large-fires-10-year-average.
- https://www.iii.org/sites/default/files/docs/pdf/triple-i_trends_and_insights_louisiana_03282023.pdf.
- https://www.carriermanagement.com/news/2025/04/16/274239.htm.
- https://www.insurancejournal.com/news/national/2022/06/01/669875.htm.
- https://royalsocietypublishing.org/rstb/article/371/1696/20150178/22917/Increasing-western-US-forest-wildfire-activity.
- https://www.frontlinewildfire.com/wildfire-news-and-resources/wildland-urban-interface-wui-and-wildfire-risks/.
- https://www.nhc.noaa.gov/pdf/hurricaneStrikesByDecade.pdf.
- https://reask.earth/resources/tropical-cyclone-model-vs-observed-data.
- https://www.moodys.com/web/en/us/insights/announcements/rms-global-catastrophe-model-leader-launches-first-climate-change-models-enabling-new-risk-insights.html.
- https://users.ece.cmu.edu/~jhoe/distribution/mit/csgmemo/memo-425.pdf.
- https://www.gfdl.noaa.gov/climate-modeling/.
- https://www.moodys.com/web/en/us/insights/insurance/catastrophe-modeling-for-a-resilient-future-powered-by-ai.html.
- https://www.ft.com/content/347a6679-8301-4f89-8b5a-dffc54c7ea27?syn-25a6b1a6=1.
It’s a Puzzlement
Unequal Coolant Tanks
aya runs a small pilot plant in which two well-stirred coolant tanks start at different temperatures. Tank A holds 2,000 liters at 90°C. Tank B holds 1,000 liters at 30°C. One pump sends coolant from A to B at 15 liters per minute, and a second pump sends coolant from B to A at the same 15 liters per minute, so both volumes stay fixed. The coolant has constant density and constant specific heat. The tanks are perfectly insulated: no heat is lost to the surroundings, and the pumps add none. Each tank remains well mixed.
(1) At the first instant, which tank’s temperature is changing faster — that is, which has the larger absolute rate of change and why?
(2) What common temperature do the two tanks approach?
(3) Find the exact time until the two temperatures differ by 1°C. A closed form is fine.
(4) Does tank A’s temperature ever fall to 50°C? If both flow rates are doubled to 30 liters per minute each way does the time in (3) exactly halve? Justify both answers.
The Phantom Current
The striking feature of this infinite ladder is that the current drawn from the battery tends to zero, yet the total energy the battery ultimately delivers is infinite.
Number the shunt capacitors 1, 2, 3, … starting at the battery. Let v(n, t) be the voltage across the nth capacitor, and write v(0, t) = 1 for the ideal one-volt source, switched on at time t = 0. Every series resistor is 1 ohm and every shunt capacitor is 1 farad. The capacitors start uncharged, so v(n, 0) = 0 for every n ≥ 1. Kirchhoff’s laws then give the discrete diffusion equation
dvn/dt = vn−1 − 2 vn + vn+1, for n ≥ 1.
The voltage on the first capacitor can be written with modified Bessel functions of the first kind. Write In for the function of order n. Then
v1 (t) = 1 − e−2t [ I0(2t) + I1(2t) ].
The battery current is the current in the first resistor. With a one-volt source, that current is also the instantaneous power, in watts:
i(t) = 1 − v1 (t) = e−2t [ I0(2t) + I1(2t) ].
The energy delivered through time T, in joules, is therefore the integral of i(t) from 0 to T.
For any fixed order n and large t, In(2t) is asymptotic to exp(2t) / √(4πt). Orders 0 and 1 share that leading term, so their sum is asymptotic to exp(2t) / √(πt). The battery current therefore simplifies to
i(t) ~ 1 / √(π t).
Integrating that tail gives
E(T) ~ 2 √(T / π),
which diverges as T tends to infinity. The battery supplies infinite total energy. The current becomes arbitrarily small, but it decays only like 1/√t, too slowly for the integral to converge. That lingering draw is the phantom current.
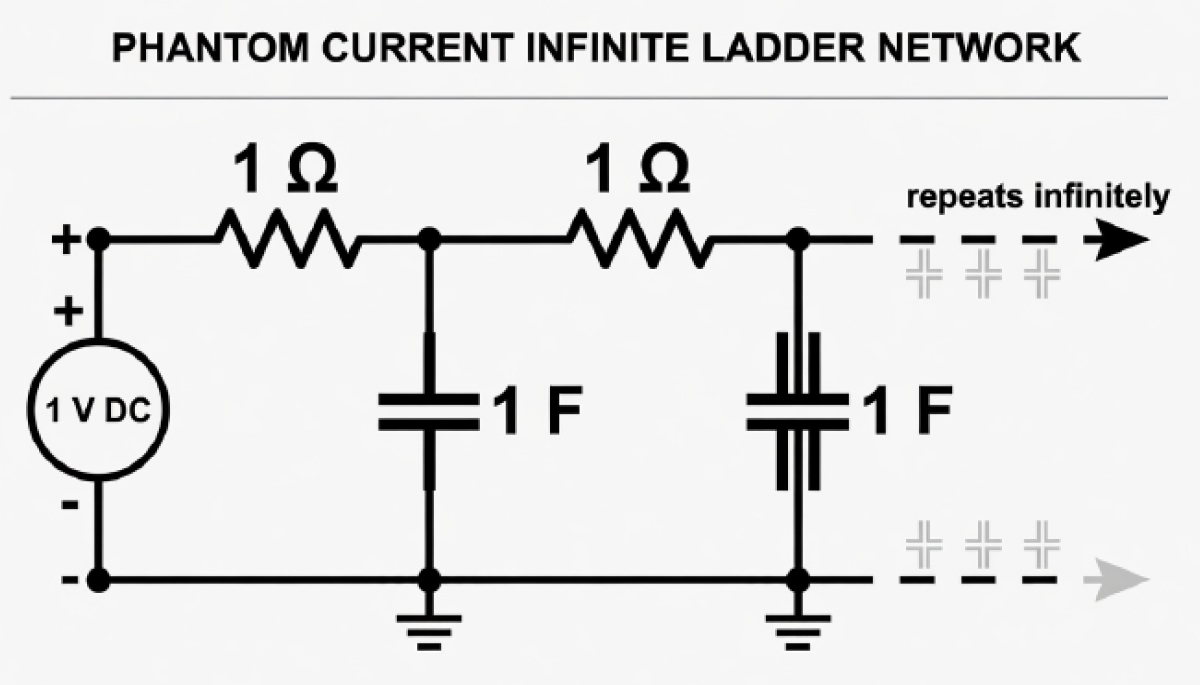
v(n, t) = 1 − exp(−2t) [ I0(2t) + 2 · (the sum of Ik(2t) from k = 1 to n−1) + In(2t) ],
where the sum is empty when n = 1. An equivalent integral form is
v(n, t) = the integral from 0 to t of (n/τ) exp(−2τ) In(2τ) dτ.
At any finite time, only a finite depth of the ladder — a depth that grows like √t — has charged appreciably. Each individual capacitor approaches 1 volt, and the source current approaches 0. The network never settles into a finite-energy steady state, because that charged region keeps advancing down an infinite ladder, and the slow tail of the current keeps feeding it.
Solutions were submitted by Mercy Amalraj and Daniel Aarhus. Daniel Aarhus also submitted a solution for the May/June puzzle titled The Programmer’s Eternal Loop.