

Insuring Solar Storms: Modeling Considerations for Space Weather Risks in Insurance Contracts
eomagnetic storms, or solar storms, were previously thought to be a concept from dystopian science fiction. More recently, they have been considered an emerging risk in the insurance industry. Solar storms are nothing new, so why are they an emerging risk now?
The largest documented storm (the Carrington Event of 1859) knocked out the biggest communication system of the time, the telegraph system. We live in a much more plugged-in, energy-dependent world now, with new data centers being planned to support our increasing dependence on artificial intelligence. As this dependence grows, the next Carrington-level event would have far more severe consequences.
While some may be of the opinion that geomagnetic storms are not insurable, these events, or the physical phenomena they can create, do meet the technical criteria for insurable risks: Geomagnetic storms are not speculative; they are due to chance; they can lead to definite and measurable losses; and they are statistically predictable. The potential for truly catastrophic outcomes, however, raises legitimate concerns about how such risks should be underwritten and managed.
That being the case, technical insurability does not always imply strategic insurability. A risk,1 even backed by sound actuarial pricing, might not be the most efficient allocation of an insurer’s capital. This paper addresses insurability concerns of solar storms and presents modeling and underwriting considerations.

Geomagnetic disturbance (GMD)
It is important to note that electromagnetic incidents can occur due to both natural and man-made causes. Natural causes include lightning strikes or severe solar activity (e.g., solar wind, solar flares, solar energetic particles (SEPs), or coronal mass ejections (CMEs)). Man-made causes include nuclear weapon detonation (either above or below atmosphere) or a non-nuclear radio frequency weapon. This paper focuses exclusively on naturally occurring events.
As with hurricanes, geomagnetic storms can be characterized using established intensity scales, several of which can serve as the basis for insurance triggers. Common indices include:
- Kp index published by the GFZ Helmholtz Centre for Geosciences.
- Ap4 (a derivation of Kp index).
- Dst (Disturbance Storm Time Index)4 maintained by the NOAA National Centers for Environmental Information. The Dst is expressed in nanoTeslas (nT), where the lower the value, the greater the intensity of the geomagnetic storm.
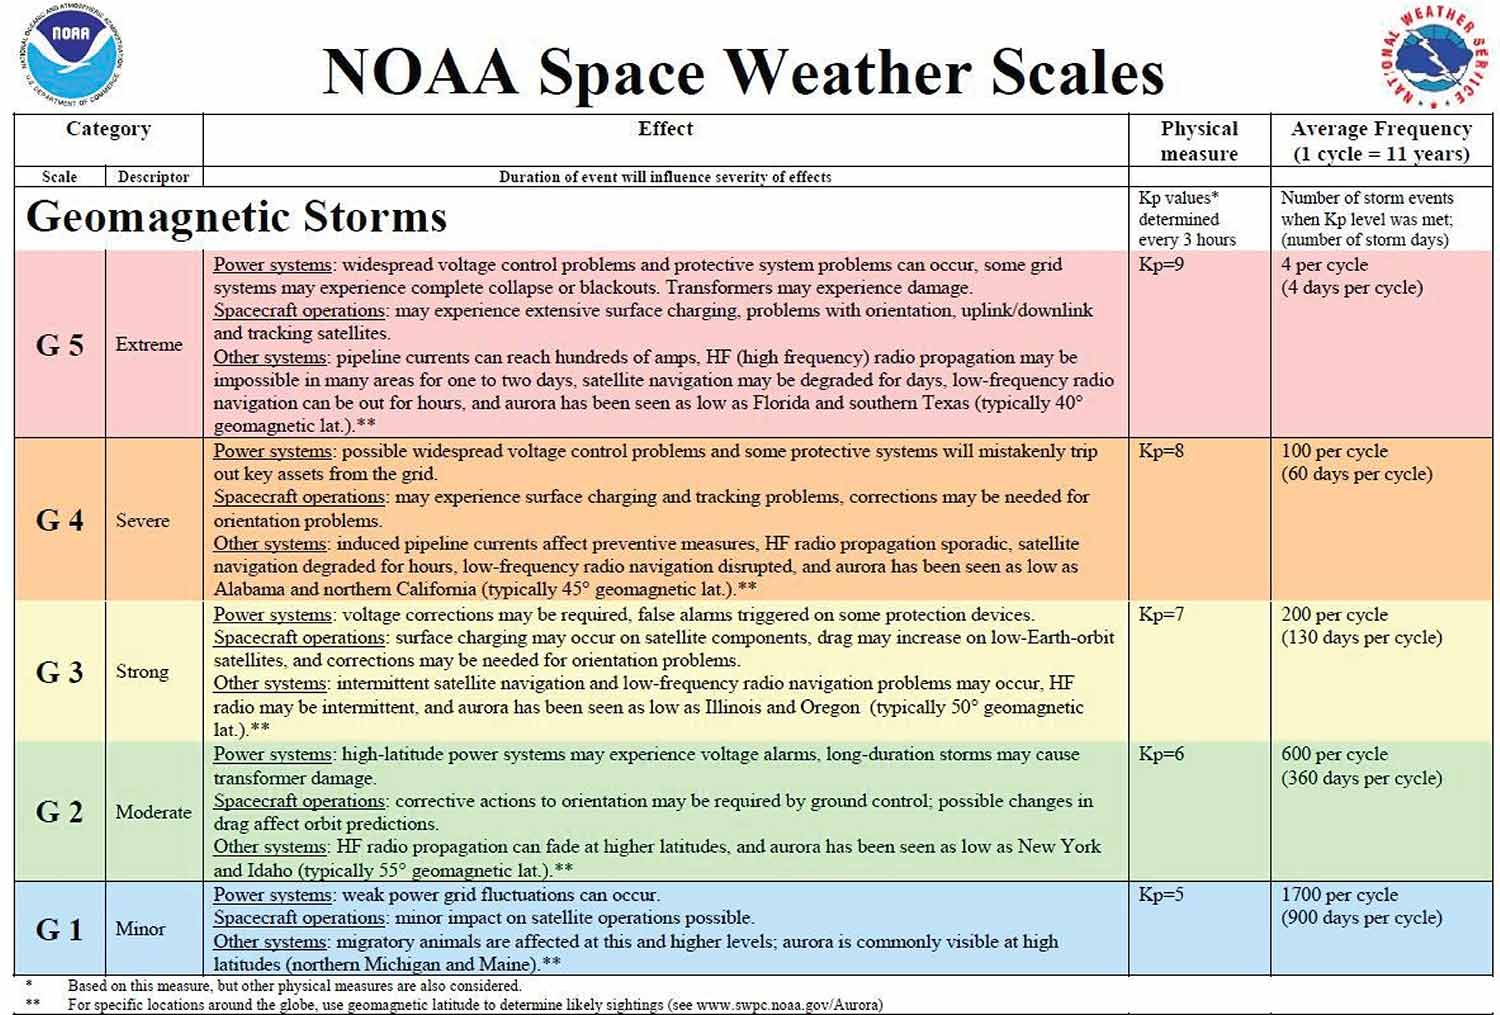
Figure 2 categorizes geomagnetic storms into five broad categories (G1 to G5) based on the storm’s Kp index. This is not dissimilar to the Saffir-Simpson Hurricane Wind Scale, which rates a hurricane’s intensity from 1 to 5, as defined by sustained wind speed.
Notable historical geomagnetic disturbance events
Subsequent notable events have continued to demonstrate the disruptive power of geomagnetic storms, especially as reliance on electrical and communication systems has grown. The 1921 New York Railroad Storm, for example, sparked multiple fires and again knocked out telegraph systems in both the U.S. and Europe. The event also impacted transatlantic cables, and while its intensity, –907 nT,7 was greater than that of the Carrington Event, and therefore less severe, its destructiveness was amplified by the increased dependence on electricity.
More recently, the 1989 Quebec storm led to the failure of the Hydro-Quebec power grid, resulting in a nine-hour blackout that affected millions. The storm also caused power transformers in New Jersey to melt, further evidencing the vulnerability of modern infrastructure. The intensity for this event was recorded at –589 nT.8
Advancements in technology have introduced new domains of risk, particularly in aviation and satellite operations. The 2003 Halloween Space Weather Storms required flights to be redirected to avoid elevated radiation levels, while Earth-orbiting satellites suffered data outages and some were temporarily lost. Although the measured intensity of this event, –401 nT,9 was greater than the 1989 Quebec storm, the consequences for aviation and telecommunications were significant. This expanded impact domain demonstrates the evolving nature of geomagnetic storm risk as society becomes increasingly dependent on complex technological systems.
Modeling of geomagnetic storm risks
Frequency
While these events may sound more like science fiction, a Carrington-level solar storm has an estimated return time similar to that of a magnitude 7.5+ earthquake in the continental U.S. A Quebec-level solar storm has an estimated return similar to that of a category 5 hurricane making landfall in the U.S.
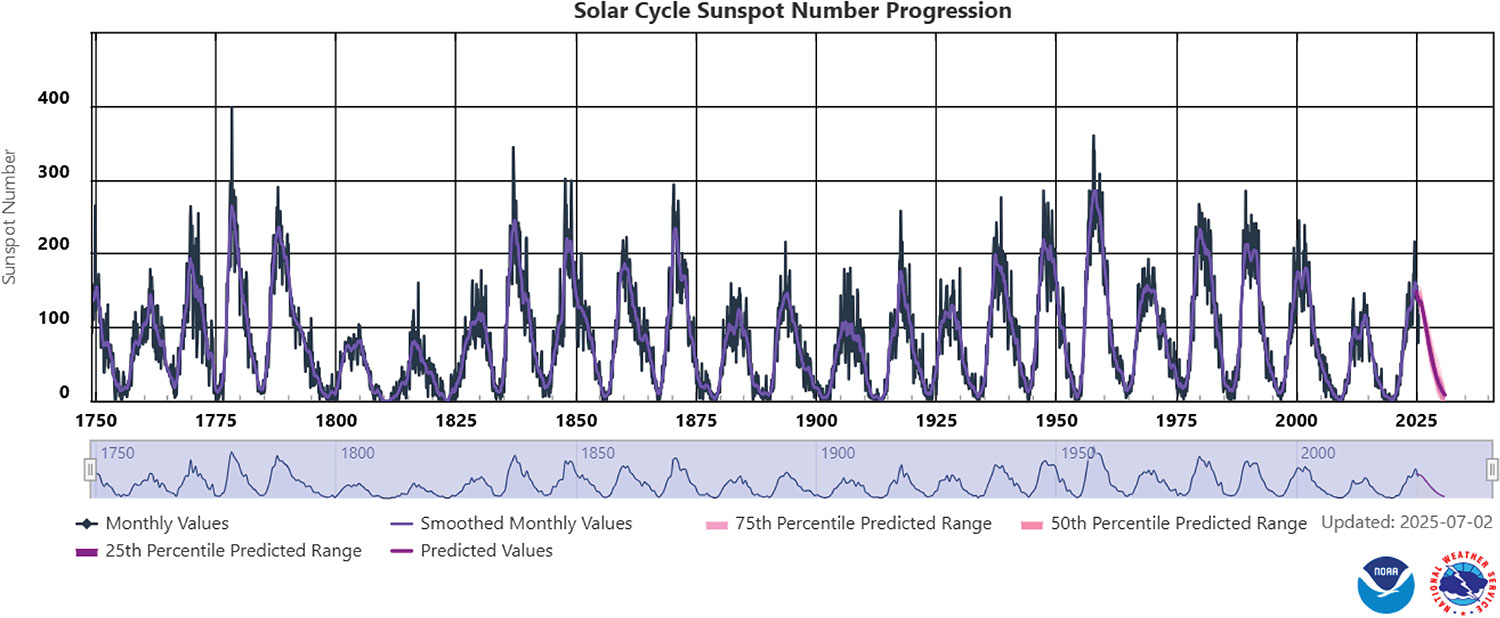
Scientific methods employed to estimate the likelihood of geomagnetic storms vary in approach and conclusion. However, scientists across the board agree that the likelihood of geomagnetic storms can vary based on where we are in the solar cycle. The solar cycle lasts approximately 11 years and captures the rise and fall of geomagnetic activity on the sun’s surface. Assuming an annual insurance policy, where those 12 months fall in the solar cycle can be determined by counting the number of sunspots.10 As a result, frequency for two policies may differ if they are at different periods of the 11-year cycle (see Figure 3).
During periods of high sunspot counts, the solar cycle is in an “active” period and the likelihood of geomagnetic storms increases. Historical and forecasted sunspots are available from various observatories. Given a policy period, insurers can reference the forecasted sunspot counts to determine the activity level and subsequently the likelihood of an event.
Let λi,s be the frequency parameter(s) for each month i of the policy for a given geomagnetic storm intensity, s (e.g., nT). Additionally, ci is the monthly sunspot count for month i.
λi,s = g(ci,s)
With this approach, λ = g(c,s) is selected to be an increasing function of sunspot count and a decreasing function of geomagnetic storm intensity. Intuitively, this captures the increase in storm likelihood during a more active period and the lower likelihood of a larger storm happening, all else being equal.11
(dλ/dc)≥0, (dλ/ds)≤0
Let ni,s be the total simulated storm count of size s in month i:
ni,s ~ f(λi | ci,s), where f is the selected discrete probability distribution.
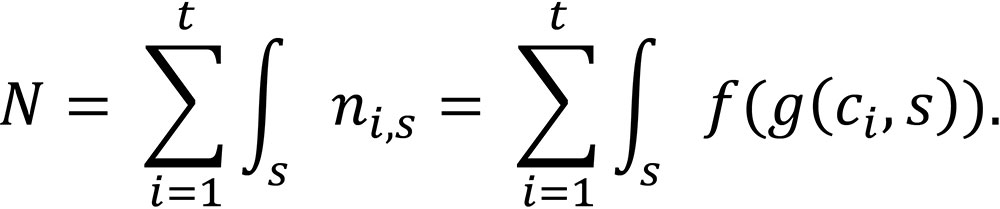
Let N be the total simulated solar storm count in a particular Monte Carlo iteration. Also, let t be the duration of the insurance contract in months (in most cases, assume t = 12). There are limited studies into event dependence, with some existing literature suggesting a relationship between probability of a large geomagnetic storm and time since the last event. Assuming s is a continuous measure of storm intensity (e.g., nT), the low event probability allows us to reasonably assume
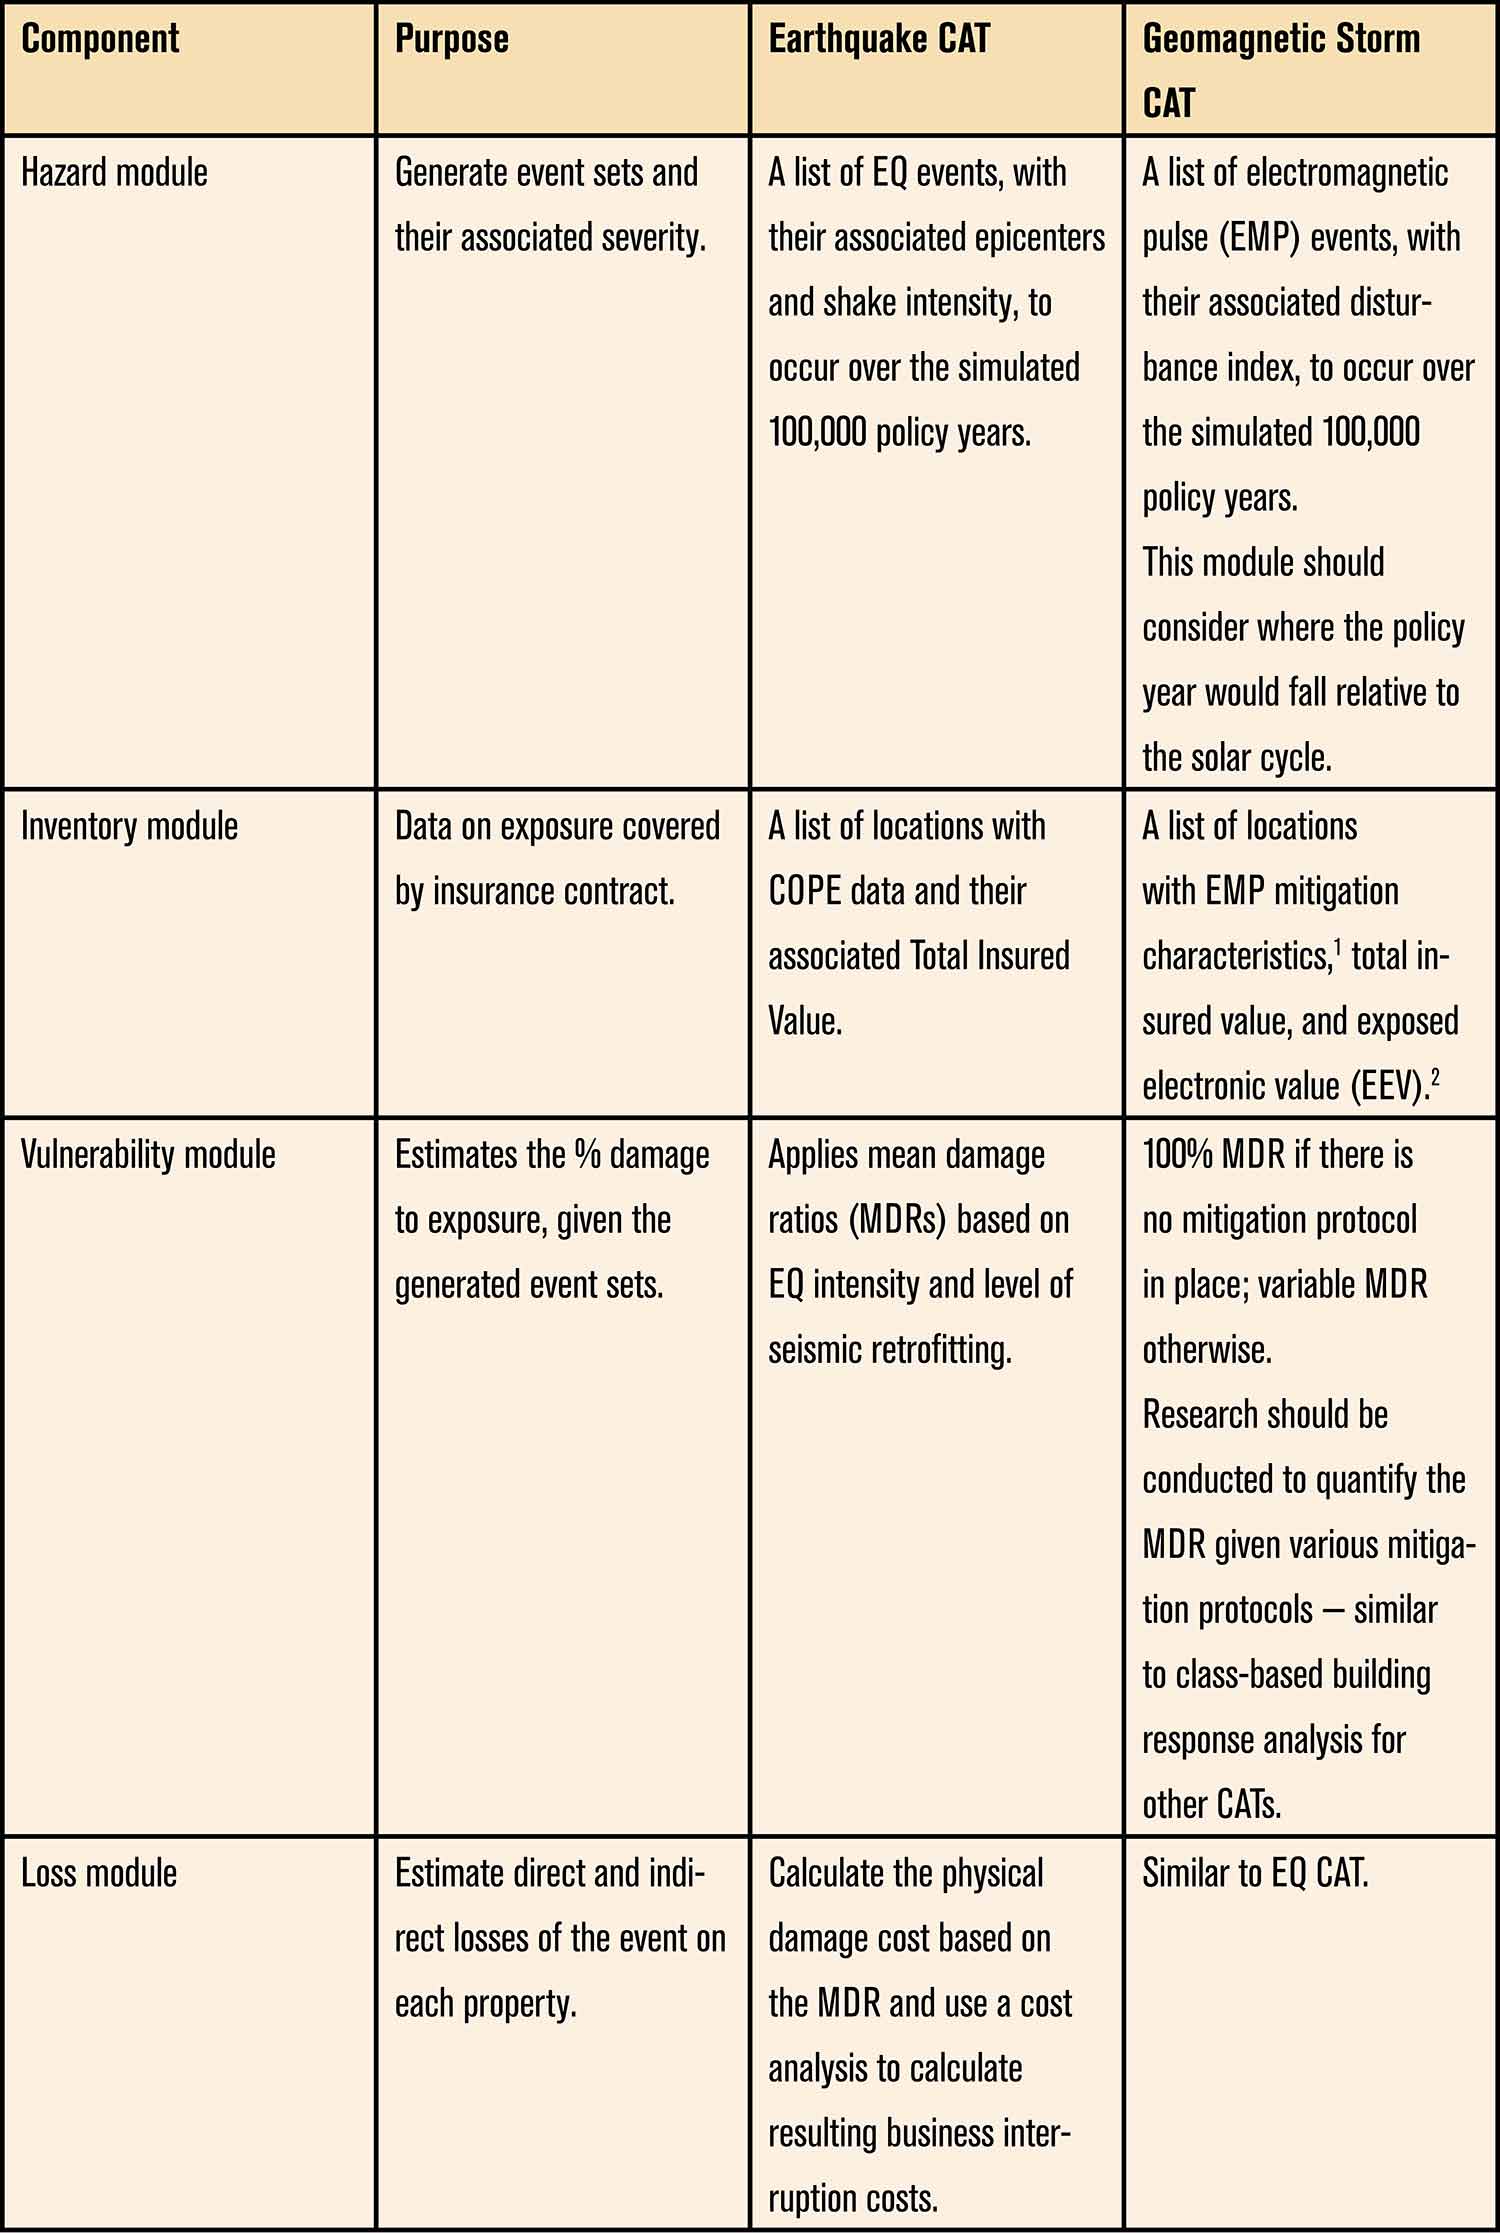
Catastrophe (CAT) model for geomagnetic storms
Total insured value (TIV) vs. exposed electronics value (EEV)
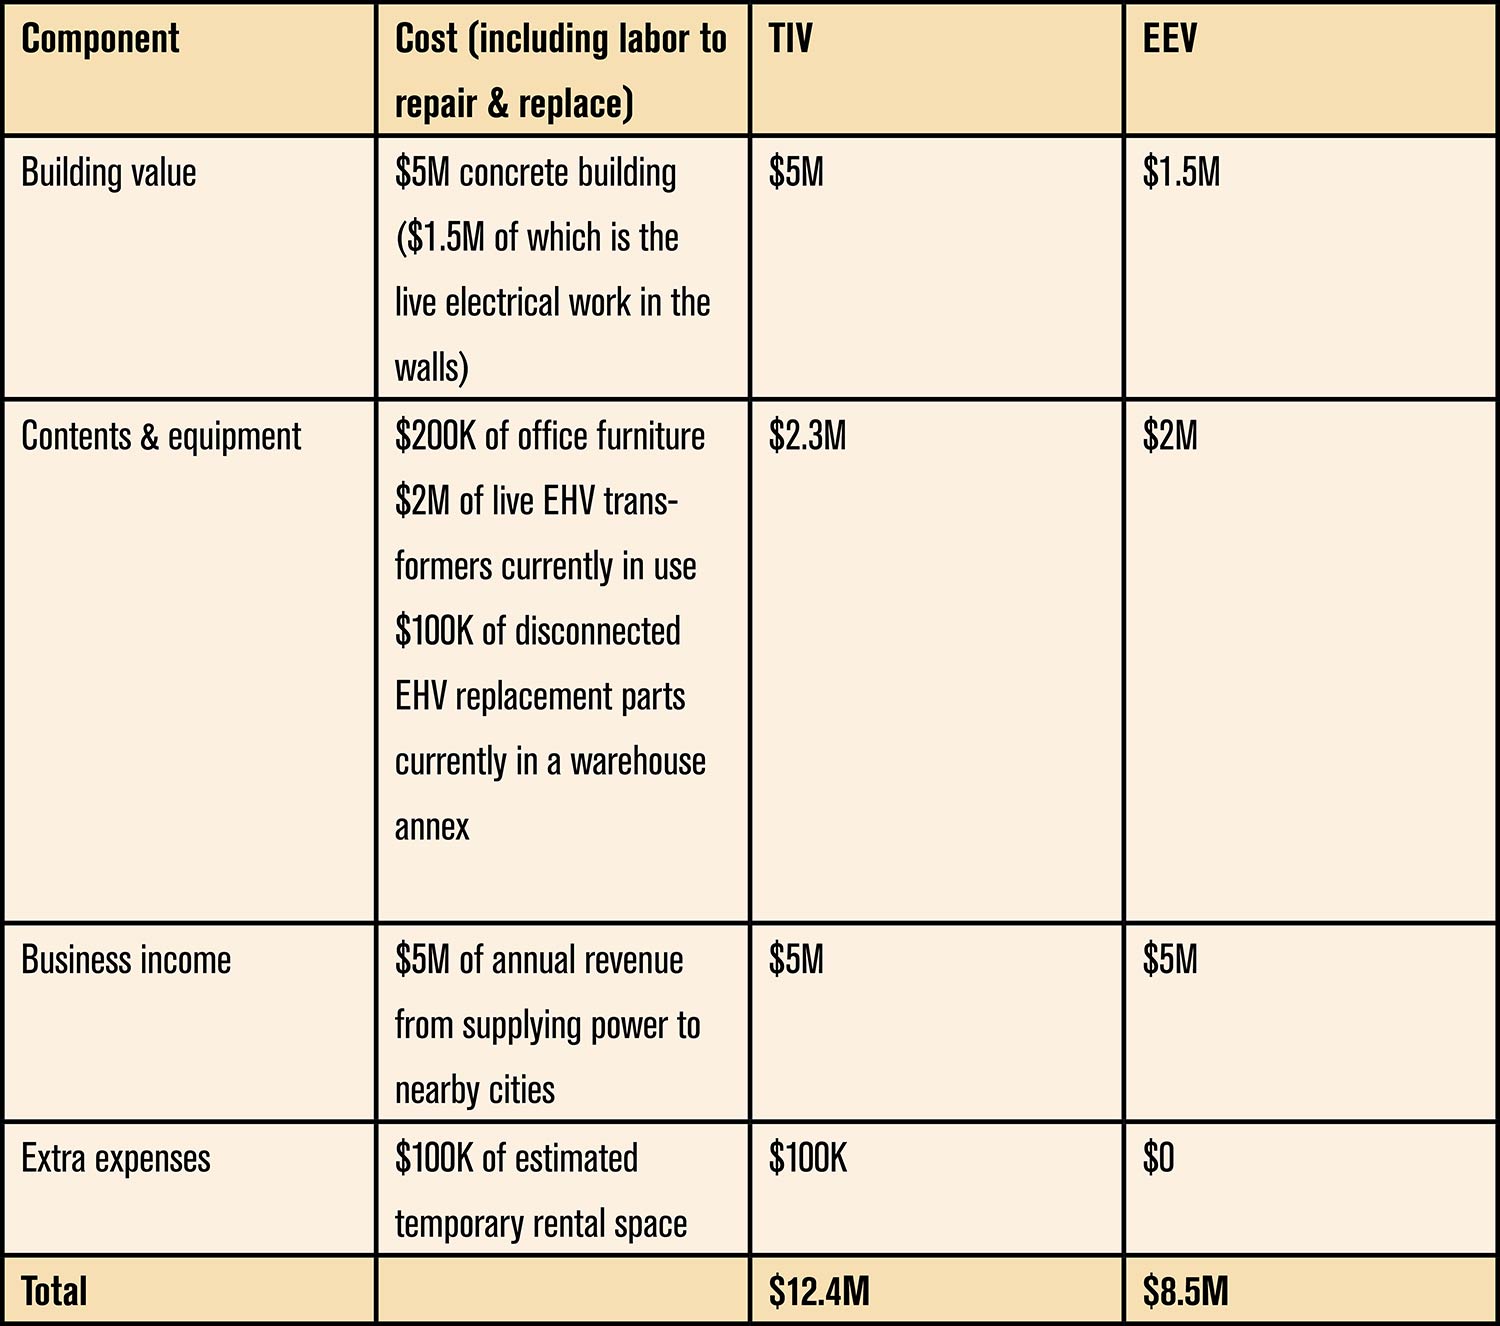
The most direct risk of geomagnetic storms is severe damage to electronic equipment and infrastructure. For example, extra high voltage (EHV) transformers can be permanently damaged following a geomagnetic storm. As of 2014, over 2,300 EHV transformers can be put at risk in the U.S.12 Unlike other catastrophe perils, the physical risk to nonelectrical equipment is low.13 Using TIV will overstate the exposure directly vulnerable to geomagnetic storms and subsequently overstate the capital needed to underwrite the risk. This paper suggests quantifying EEV using the following equation:
Exposed Electronics Value
= Total Insurable Value — Nonelectrical Building Value
— Nonelectrical Contents & Equipment
— Disconnected Electrical Contents & Equipment
Consider the exposure of a power plant in Table 2.
Current geomagnetic storm coverage in insurance contracts
A standard commercial property insurance policy does not explicitly exclude damage due to a geomagnetic storm. Property insurance may cover property damage and business income losses in the event of a loss due to a covered peril. For example, a fire starts because of a power surge from a geomagnetic storm. Assuming geomagnetic storm is not an explicitly excluded peril, a standard property insurance would pay out for the physical damage, as well as the corresponding business interruption.
A business may need to consider specific coverage or potentially available coverage under other policies, such as cyber (data loss or electronic disturbance), equipment breakdown (damage to electrical systems), or business interruption (due to power grid failure). These still may leave gaps in coverage for a business with significant electrical infrastructure.
- While not dicussed in detail in this paper, example strategies include blocking capacitors and electromagnetic shielding (e.g., Faraday cages).
- See Total Insured Value (TIV) vs. Exposed Electronic Value (EEV) section.
Issue #1: Remote electrical infrastructure
Issue #2: Business interruption gap
As a practical metric for structuring a parametric policy, the NOAA Space Weather Scales can be referenced. The similarity to more familiar weather scales, such as the Saffir-Simpson hurricane category system, could aid in the underwriting and explanation of coverage triggers.
Issue #3: Aggregation risks for insurers and reinsurers
The 1989 Quebec event caused damage in a limited area, similar to what you might find in a more frequent catastrophe. The Carrington Event caused damage across North America and Europe. Concerns regarding events reaching Carrington-level intensity or beyond should not preclude the development of geomagnetic storm coverage, as there are effective strategies to address such scenarios.
In addition, more traditional risk management strategies such as risk mitigation and additional reinsurance could address aggregation concerns.
Future Considerations
Conclusion
From an insurance perspective, this risk meets the fundamental criteria of insurability, yet today it sits uncomfortably in coverage gray zones. Traditional property policies may respond inconsistently, coverage may be fragmented across multiple lines, and in many cases, carriers may be silent on the peril altogether. This ambiguity creates a false sense of security. Concentration risk, accumulation across portfolios, and the potential for correlated losses amplify the stakes for both insureds and insurers.
As dependence on electrification, digital infrastructure, and just-in-time systems continues to accelerate, the financial impact of a solar storm is likely to grow over time. Failing to explicitly identify, quantify, and structure coverage for this exposure leaves organizations vulnerable to losses that could materially impair balance sheets and operational resilience. Addressing this risk will likely require moving beyond traditional approaches, including the consideration of alternative risk transfer solutions such as parametric insurance, as well as more granular Statements of Values that reflect the true nature of the exposure.
The absence of a recent catastrophic event should not be mistaken for the absence of risk. Solar storms are inevitable; the only uncertainty is timing. The question facing risk managers, insurers, and reinsurers is not whether this peril should be addressed, but whether it will be addressed deliberately and proactively or discovered after the fact through loss.
- Technical insurability addresses if the risk can be modeled and a technically sound premium estimated. Strategic insurability addresses if the capital should be deployed to insure the risk regardless of our ability to generate a premium. For more see: Gutterman S. “What Is Insurable? It Depends.” Contingencies, March/April 2025. https://actuary.org/article/what-is-insurable-it-depends/.
- https://www.iso-ne.com/about/what-we-do/geomagnetic-disturbances.
- Lloyd’s 2013. “Solar Storm Risk to the North American Electric Grid.” https://assets.lloyds.com/assets/pdf-solar-storm-risk-to-the-north-american-electric-grid/1/pdf-Solar-Storm-Risk-to-the-North-American-Electric-Grid.pdf.
- Kp measures a three-hour disturbance in the Earth’s magnetic field, averaged from 13 observatories. Dst is the hourly Kp index, averaged from four observatories. Ap is the weighted daily average of the Kp index.
- Thompson, Jay R. “How Strong Was the Carrington Event?” Earth Magazine, January 2013. https://www.earthmagazine.org/article/how-strong-was-carrington-event/.
- Kumar P., et al. “Analysis 2023 Storms Based on Different Time Scales (Dst, Kp & Sym/H).” Journal of Space Safety Engineering, March 2025. https://doi.org/10.1016/j.jsse.2024.12.002.
- Boteler, D. H. “A 21st Century View of the March 1989 Magnetic Storm.” Space Weather, 2019, Vol. 17, Issue 10. https://doi.org/10.1029/2019SW002278.
- Boteler, D. H. “A 21st Century View of the March 1989 Magnetic Storm.” Space Weather, 2019, Vol. 17, Issue 10. https://doi.org/10.1029/2019SW002278.
- Weaver M. “Halloween Space Weather Storms of 2003.” NOAA Technical Memorandum OAR SEC-99, 2004, 28. https://repository.library.noaa.gov/view/noaa/19648.
- According to the National Oceanic and Atmospheric Administration (NOAA), sunspots are dark areas that become apparent at the Sun’s photosphere because of intense magnetic flux pushing up from further within the solar interior.
- Or in the case of nanoTeslas, g(c,s) would be an increasing function of s given that a higher nanoTesla value indicates lower intensity. See the first section for more detail.
- Electric Utility Annual Reports, 2014
- Secondary perils, such as electrical fires leading to building damage, may need additional modeling considerations based on other factors, such as COPE data.