
Contents
departments
- EDITOR’S NOTE
- The Four Sides to Every Story
- President’s Message
- More Than Just a Logo
- Member News
- Comings and Goings
- Calendar of Events
- In Remembrance
- In Memoriam
- Making Things Happen
- CAS Staff Spotlight
- 2025 Annual Report of the CAS Discipline Committee Released
- CAS Discipline Committee Panel Issues Ruling
- Celebrating the 2025 CAS Volunteer Award Winners
- Professional Insight
- Developing News
- The Hidden Costs of Good Intentions: How Disaster Bailouts
- Actuarial Expertise
- Rethinking Loss Triangles for IFRS 17: How the Risk Attribution Index (RAI) Reveals the Limits of Frequency–Severity–Inflation Decomposition
- From Hype to Help: A Practical GenAI Workflow for Actuaries
- A New Way to Model Catastrophes in a Changing Climate
- Viewpoint
- Ethical Issues
- Solve This
- It’s a Puzzlement
on the cover
-
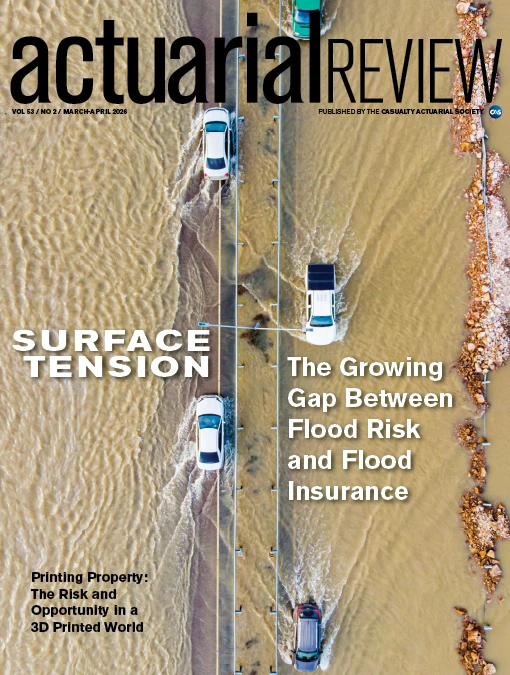 As floods become more frequent, localized, and harder to categorize, insurance coverage has failed to keep pace. This article explores why flood risk is now better understood than ever, yet still largely uninsured, and what it will take for public and private markets to finally close that gap.
 -
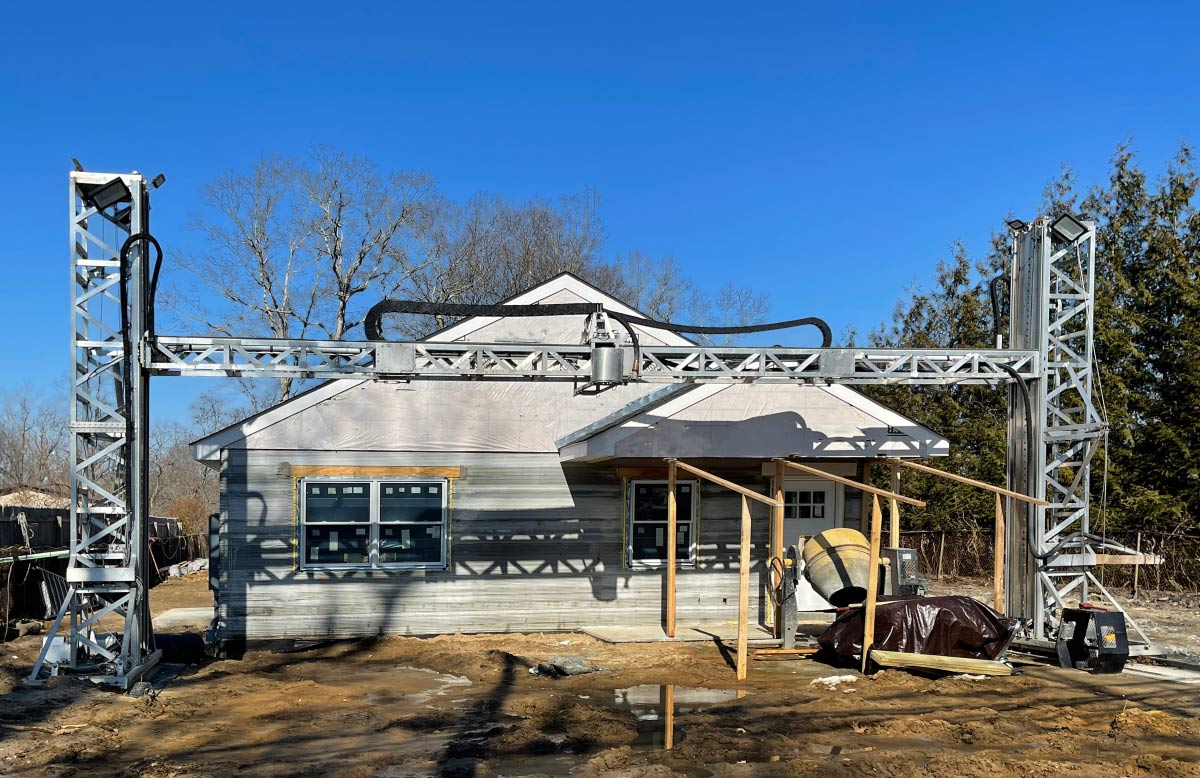
What happens to property risk when buildings are printed instead of built? This article explores how 3D printed construction could reshape underwriting, resilience, and insurability — revealing both surprising risk-reduction opportunities and new challenges for property insurers.
The amount of dues applied toward each subscription of Actuarial Review is $10. Subscriptions to nonmembers are $50 per year. Postmaster: Send address changes to Actuarial Review, 4350 North Fairfax Drive, Suite 250, Arlington, Virginia 22203.
Masthead
-
Editor in Chief
Jim Weiss
-
CAS Director of Publications and Research
Elizabeth A. Smith
-
AR Managing Editor and CAS Editorial/Production Manager
Sarah Sapp
-
CAS Managing Editor/Contributor
Greg Guthrie
-
CAS Graphic Designer
Sonja Uyenco
-
CAS Cross-Functional Coordinator/Contributor
Delilah Barrow
-
News Editor
Sara Chen
-
Opinions Editor
Richard B. Moncher
-
Editors
- Colleen Arbogast
- Daryl Atkinson
- Karen Ayres
- Glenn Balling
- Robert Blanco*
- Lisa Brown
- Michael Budzisz
- Sumanth Chebrolu
- Todd Dashoff
- Daniel Jay Falkson*
- Stephanie Groharing
- Julie Hagerstrand
- Srinand N. Hegde*
- Cameron Herrmann*
- Kenneth S. Hsu
- Cindy Hu*
- Jack Huang*
- Rachel Hunter*
- Rob Kahn*
- Benyamin Kosofsky
- Julie Lederer
- Albert Lee
- David Levy
- James Li*
- Sydney McIndoo
- Stuart Montgomery
- Sandra Maria Nawar*
- Erin Olson
- Shama S. Sabade
- Michael Schenk
- Robert Share
- Craig Sloss
- Jared Smollik
- Andrew Somers*
- Bella Thiel*
- Isaac Wash*
- Radost Wenman
- Ian Winograd
- Vanessa Wu*
- Xuan You*
- Yuhan Zhao*
-
*Writing Staff
-
Puzzle
Jon Evans
-
Advertising
Al Rickard, 703-402-9713
arickard@assocvision.com -

The Casualty Actuarial Society is not responsible for statements or opinions expressed in the articles, discussions or letters printed in Actuarial Review. -
For permission to reprint material from Actuarial Review, please write to the editor in chief. Letters to the editor can be sent to AR@casact.org or the CAS Office. To opt out of the print subscription, send a request to AR@casact.org.
Images: Getty Images -
© 2026 Casualty Actuarial Society.
ar.casact.org
The Four Sides to Every Story
popular saying goes, “There are two sides to every story.” A variation goes, “There are three sides to every story — yours, theirs, and the truth.” Still another twist, attributed to Rousseau, provides: “There are four sides to every story — your side, their side, the truth, and what really happened.” The latter differentiates between facts we observe and complex realities that underlie them, while also framing stories in the shape of buildings.
Throughout 2025’s Volume 52 AR’s authors told a familiar story — unprecedented disasters, imperfect responses, fraying trust, and public sector intervention. AR presented steps the industry could take to rewrite the story — more effective regulation, product design, communication, and institutional investing. These insights targeted truth as measured in fiscal currency. March 2026’s AR dives deeper into the immeasurable.
It turns out the four-sided building metaphor implicit in Rousseau’s saying has cracks. In this issue, Vanessa Wu, ACAS, illustrates how a 3D-printed wall slab is situated amorphously in a manner analogous to soft serve ice cream. By that view, almost any story could have infinite sides. And when it comes to buildings, stories can be erected quickly and economically — potentially reshaping the dynamics of predict versus prevent.
Either way, buildings contain more substance than wood, concrete, or steel. The empathy we feel when Mother Nature tears things down inclines society to restore what it can, even as the most important things in our lives can never truly be replaced. Such empathy is not always congruent with the reality of disaster propensity. As Cindy Hu, ASA, explores in her AR feature, rebuilding in harm’s way is often the first chapter in the next tragedy.
One microcosm for the structural flaws that leave citizens exposed to danger is flood insurance in the U.S. Improved actuarial precision and a more robust private marketplace have yet to plug critical coverage gaps, as was evident in the aftermath of catastrophic Texas flooding in 2025. In his cover story, DJ Falkson, FCAS, examines the history and future of this public-private partnership. Together Vanessa, Cindy, and DJ provide three windows into a complex reality. Hopefully this gives readers a better view of what lies beneath.
Actuarial Review
Casualty Actuarial Society
4350 North Fairfax Drive, Suite 250
Arlington, Virginia 22203 USA
Or email us at AR@casact.org

More Than Just a Logo
n my previous Actuarial Review message, I highlighted a few of the CAS priorities for the 2025–26 operating year and a few of the projects I am particularly focused on as president. In this issue’s message, I am going to delve deeper into one of those projects — the refresh of the CAS brand. Before we get into the specifics of the project itself, though, it is worth taking just a minute to consider what a “brand” actually represents and why it matters.
What is a “brand?”
In other words, an organization’s brand is a function of what people believe it stands for, how they expect the organization (and its members) to behave, and how they feel when they interact with the organization and its members. So, while logos, color palettes, and taglines can all be useful in expressing and communicating a brand image, the brand exists separately from those items and has a life of its own. The CAS brand refresh project, therefore, is not so much about trying to change our brand as it is to better understand, represent, and communicate it.
Still, whenever “branding” or “brand refresh” comes up within an organization, people often have questions like:
- Is our logo going to change?
- Are we switching to new colors?
- What will this cost us?
- Why is this happening now?
Some may even think of past rebranding missteps with Cracker Barrel, Jaguar, and Bud Light and worry that changing branding strategy could create similar issues.
These reactions are perfectly natural, particularly in a professional organization like the Casualty Actuarial Society — whether you refer to it by its full name, “The C-A-S,” or CAS (pronounced “kaz”). Actuaries tend to be seen as risk-averse, highly analytical, traditional, and serious, so the idea of refreshing our brand might seem out of character. Nevertheless, after conducting market research, the CAS Board endorsed moving forward with a brand refresh, which is now well underway.
Branding reaches far beyond just logos or color schemes — it encapsulates how a professional society communicates its mission, values, and credibility. A strong, unified brand enables members, partners, and the broader community to easily understand what the Society stands for and why it makes a difference. It establishes trust, underscores professionalism, and nurtures a sense of belonging among members. In a busy environment where many groups compete for attention, effective branding helps a professional society distinguish itself with confidence, clarity, and a compelling identity that draws in others and inspires pride.
Why now?
CAS market research confirms that we are the gold standard for P&C credentialing, respected for high standards and prestige among those who know us well. At the same time, research shows an awareness and understanding gap among those less familiar with the CAS and its mission. Our strength is well established; our opportunity is to ensure that strength is clearly recognized and understood in a crowded and often noisy marketplace.
Is it worth the cost and effort?
A clear and consistent brand enhances recognition and bolsters the credibility of CAS credentials. It affirms members’ professional authority among employers, regulators, and interdisciplinary colleagues. Well-defined positioning enables stakeholders to appreciate the unique value CAS members contribute to addressing complex risk challenges, ensuring that our credential’s significance remains robust for both current members and future generations. Safeguarding and advancing the strength of the CAS credential is a fundamental responsibility of the board, which is why “Reinforcing Our Differentiated Brand” is a central pillar of the CAS Strategic Plan.
What will the brand refresh include?
The CAS is the trusted global authority advancing the practice of property and casualty actuarial science, helping people, businesses, and communities unlock opportunity and thrive in a rapidly changing world.
Over the coming year, members can expect to see a thoughtful evolution of messaging, tone, and visual identity across CAS channels, and greater consistency and clarity in how we communicate with different audiences — those who know us well and those just getting to know us. As we proceed, members should feel confident in the brand refresh effort. These decisions are grounded in market research and testing conducted by the CAS Board. The results will be informed by how members, employers, and future candidates engage with the CAS today. Members should also look forward to seeing the CAS take a modern approach to showing up in a digital-first world, while preserving the high standards, values, and mission that define the CAS.

Yes, but are we changing the logo and colors?
Closing thoughts
Actuarial Review Letters Policy
Letters shall not contain personal attacks or statements directly or implicitly denigrating the characters of individuals or particular groups; false or unsubstantiated claims; or political rhetoric. Letters should be no more than 250 words and must include the author’s name and phone number or email address, so the editorial staff can confirm the author. Anonymous letters will not be published. There shall be no recurrence of topics; issues previously addressed will not be the subject of continued letters to the editor, unless new and pertinent information is provided. No more than one letter from an individual can appear in every other issue. Letters should address content covered in AR. Content regarding the CAS Board of Directors or individual departmental policies should be directed to the appropriate staff and volunteer groups (e.g., board, working groups, committees, task forces, or councils) instead of AR. No letter that attempts to use AR as a platform for an ulterior purpose will be published. Letters are subject to space limitations and are not guaranteed to be published. The AR editorial volunteer and staff team reserves the right to edit any submitted letter so that it conforms to this policy. Decisions to publish letters and make changes to submissions shall be made at the discretion of the AR Working Group and CAS staff.
For more information on AR editorial policies, visit here.
Comings and Goings
Laura Maxwell, FCAS, MAAA, CSPA, has been promoted to principal and consulting actuary at Pinnacle Actuarial Resources. She previously served as director and consulting actuary, a title she held since 2021. Maxwell has worked in the P&C insurance industry since 1987 and joined Pinnacle in 2006. Her prior experience includes positions with a consulting firm, an automobile insurer, a state insurance department, and a national rating bureau. At Pinnacle, she leads the firm’s supervisor and professionalism key management areas. She also serves as appointed actuary for multiple insurers and collaborates with state insurance departments, captive insurance companies, and self-insured public entities. She chairs the Casualty Loss Reserve Seminar Working Group and serves as a general officer on the Syllabus and Examination Working Group at the CAS.
Calendar of Events
-
May 3–6, 2026
2026 CAS Spring Meeting
New York, NY -
May 31–June 2, 2026
2026 CAS Seminar on Reinsurance
Philadelphia, PA -
July 28–Sept 1, 2026
2026 CAS Virtual Workshop: Introduction to Python for P&C Insurance
Virtual -
September 14–16, 2026
2026 Casualty Loss
Reserve Seminar
Las Vegas, NV -
November 8–11, 2026
2026 CAS Annual Meeting
Honolulu, HI

In Remembrance
A CAS Past-President
1940–2025
CAS Past President, David Flynn, FCAS, passed away in November 2025, in Sparta, New Jersey. Flynn, who served as CAS President from 1993–1994, was born in Peckville, Pennsylvania, the middle sibling of six brothers and sisters. He and his family lived in Greenbelt, Maryland, before moving to San Francisco when he was 15. He graduated from St. Ignatius High School, received his B.S. in math from San Francisco State University. He worked in several firms, including Crum & Foster, where he was appointed chief actuary. Flynn was also a volunteer for the U.S. State Department. After the collapse of the Soviet Union, he traveled with other U.S. financial professionals to educate Eastern European officials on standard Western financial practices. Flynn settled in Sparta, New Jersey. Locally, Flynn volunteered as an assistant scoutmaster for the Boy Scouts and served as a deacon at the Sparta Presbyterian church. After retirement, Flynn volunteered as treasurer of People Help of Sussex County for many years and served as a member of the Sussex County Democratic Committee. Flynn was a proud father to five children: Michael, Colleen, Erik, Elizabeth, and Karen, who predeceased him. He was grandfather to seven and a great-grandfather to 11. In his spare time, Flynn enjoyed reading extensively, traveling the world, visiting family, or relaxing at their lakeside cabin in Maine with his beloved wife of 45 years, Sally Larson.
The Faithful, Traveling Mathematician
1957–2026
David Lee, FCAS, CPCU, passed away in January in Bloomington, Illinois. He graduated from Floyd Valley High School in 1976. He earned his B.A. in mathematics from Northwestern College and his M.S. in statistics from the University of Nebraska. He had a distinguished 35-year actuarial career at State Farm Insurance, finishing as Countrywide Pricing Director in the Property and Casualty Actuarial Department. Lee volunteered with the CAS from 1987–2011, most notably serving as the vice president of Admissions from 2008–2011, garnering him the Matthew Rodermund Memorial Service Award. Lee was a lifelong athlete, lettering in college baseball and football, and later playing on community baseball and softball teams. Lee also founded and coached a middle school travel baseball team (the Bullets), benefiting dozens of student athletes in the community. In his retirement, Lee often played golf at Ironwood Golf Course. Lee’s favorite way to end the day was sitting on an upside-down bucket, casting a fishing line into the neighborhood pond. A devout Christian, he leaves behind a legacy of dignity, steadfastness, faithfulness, kindness, and generosity. Lee’s family will miss traveling with him but will not lovingly miss his nonstop math quizzes. Lee is survived by his wife of 49 years, Cindy; three children, Susan (Dan) Nelson of Thompson’s Station, Tennessee; Tom (Sydney) Menning of Fox Lake, Illinois; Lea (Jim) Nelson of Bloomington, Illinois; seven grandchildren: Avery and Romey Nelson; Riley, Leighton, Margot, and Lucy Menning; and Evelyn Nelson; and two siblings, Bruce (Cathy) Menning and Kaye Bennett. Lee was preceded in death by his parents, Alden and Connie Menning.
In Memoriam
1940-2025
David Lee Menning (FCAS 1986)
1957-2026


membernews
Making Things Happen
Chandu Patel: Saying “Yes” and Showing Up

Chandu and Hima Patel enjoying Chiang Mai, Thailand.
handrakant (Chandu) C. Patel, FCAS, MAAA, is a name synonymous with dedication, leadership, and innovation in P&C actuarial practice. With more than three decades as both a practitioner and a volunteer leader, Patel has quietly shaped how actuaries understand and perform reserving — one of the most crucial and complex activities in insurance. His long‑standing service with the CAS has not only advanced the profession’s technical capabilities but has also fostered opportunities for others to grow in their careers and contribute meaningfully to actuarial research.
Patel’s journey with the CAS began shortly after he achieved Fellowship in 1994. Fueled by a desire to contribute back to the profession that had nurtured his own development, he raised his hand to grade and set exam questions — an early and essential form of service that impacts every new Fellow who follows. From there, he expanded his volunteer footprint into continuing education and research, joining the Casualty Loss Reserve Seminar (CLRS) Working Group and the Reserves Working Group. Over time, these early roles grew into significant leadership responsibilities that now influence the CAS’s research agenda and member development offerings.
Today, Patel serves as chair of the CAS Reserves Research Working Group, vice chair of the CLRS, and as a member of the CAS Discipline Committee. In these capacities, he performs a remarkable balancing act between guiding high‑impact research, planning large‑scale professional seminars, and upholding the integrity and accountability of the profession.
At the heart of Patel’s volunteer contributions is his leadership of the Reserves Working Group. Under his guidance, this group serves as a beacon for practical, innovative, and timely reserving research for the CAS membership. The working group’s mission is to identify pressing issues in reserving, sponsor research on those issues, and shepherd high‑quality work through to publication — all in ways that maximize relevance for working actuaries.
In recent years, the Reserves Research Working Group has produced an impressive body of research papers offering practical insights on applying emerging technologies and methodologies to reserving challenges. These papers help actuaries stay current with advances in data science, predictive methods, and real‑world practice needs. Many of these published studies are showcased at professional meetings such as the CLRS, ensuring that research findings translate directly into tools actuaries can apply in their daily work.
The group’s call paper programs have created an accessible pathway for analysts, academics, and seasoned practitioners alike to publish on topics of evolving importance. This structure not only expands the body of reserving literature, it nurtures new research talent — something that Patel deeply values as part of his volunteer mission.
Looking ahead, Patel and his colleagues are preparing an ambitious paid research proposal to develop an AI‑assisted reserving tool. The goal is to help reserving actuaries at every stage of the process, from selecting methodologies to conducting peer reviews and strengthening documentation. In addition, the working group is planning an exciting 2026 Call for Papers focused on evolving technology for data handling, manipulation, and application to new reserving methodologies.
For Patel, the goal of all this work is straightforward: to keep members abreast of the latest developments and provide them with tools that make them more successful in their jobs. His leadership reflects a belief that research should be both rigorous and practical, serving the profession as a whole.
Beyond research, Patel plays a key role in organizing one of the CAS’s most respected professional education events: the CLRS. As vice chair, he collaborates with fellow volunteers to brainstorm seminar topics, recruit expert speakers, and design an agenda that reflects the evolving needs of reserving actuaries.
CLRS consistently draws hundreds of professionals eager to deepen their technical skills and stay current with industry trends. Through his work, Patel helps ensure that the CLRS remains relevant, forward‑thinking, and deeply connected to the day‑to‑day practices of reserving actuaries.
Patel’s commitment to the actuarial profession extends beyond CAS volunteer roles. He has over 38 years of experience in P&C reserving and financial reporting, including senior actuarial roles with prominent insurers. This professional foundation gives him a deep perspective to draw from when guiding research initiatives or shaping seminar content.
Along the way, he has earned recognition for his contributions. Notably, in 1998 he received the CAS Reserves Prize for the best reserve paper, an early professional honor that foreshadowed his wider impact on the field. He has also contributed to the profession through editorial work, including involvement with a book on catastrophe management.
Reflecting on what he is most proud of, Patel points to the relationships he has built through volunteer service — especially the note of appreciation from a seasoned member who told him he was the best working group chair with whom he had worked. For Patel, that recognition meant more than awards; it affirmed that how a volunteer leads matters just as much as what gets accomplished.
Throughout his volunteer journey, Patel has been motivated by a desire to give back. “The CAS has provided me with a tremendous opportunity to educate myself and to further my career more than I had ever hoped,” he reflects. “I volunteer to give back and to provide the same opportunities to others.”
Patel’s volunteer journey is a masterclass in service, leadership, and generosity of spirit. From exam grading rooms to research committees, from seminar-planning sessions to discipline oversight panels, he has given his time and expertise to make the CAS stronger, more innovative, and better prepared for the future.
Patel’s dedication to his craft is matched by his love for life beyond work. He and his wife share a passion for travel and adventure, recently exploring Vietnam and Thailand.
As the CAS continues to evolve in an era of emerging technology, data transformation, and shifting industry dynamics, volunteers like Patel provide the steady anchor of experience, vision, and commitment that the profession needs.
His story is an inspiring reminder that making things happen often starts with saying “yes” and showing up for the community we serve.
CAS Staff Spotlight
Meet Max Baskin, CAS Data Analyst

Max Baskin
elcome to the CAS Staff Spotlight, a column featuring members of the CAS staff. For this spotlight, we are proud to introduce you to Max Baskin.
- What do you do at the CAS? How does your role support the Strategic Plan?
I began my role as a data analyst in October 2025. My primary role this year is to support the transition to our new association management system and help ensure that the CAS candidate and member online experience is as smooth as possible. This involves supporting exam score releases, fixing data and system errors, liaising with our IT development partners, and more. I also help empower other CAS staff by creating dashboards, helping to set up mass emails, and providing general IT and data analysis support. This all allows me to help support the CAS Strategic Plan, especially regarding enhancing the candidate experience and advancing operational excellence.
- What inspires you in your job and what do you love most about it?
Data analysis is not just a science; it is an art. At first glance, the work of data science and visualization might seem straightforward, but I’ve found that there are actually a lot of really interesting nuances regarding design choices, audiences, and emphasis. Whenever I work together with the IT team to create a complex Excel table or dashboard for our stakeholders, I always enjoy considering how others will view our products from their own perspectives and thinking about what I can do on my end to make the data even more beautiful.
- Describe your educational and professional background. What do you bring to the organization?
Before graduating last year, I had internships in various fields, including IT support, victim/witness assistance, fraud analytics, and more. While all of these experiences were in different industries, they all involved data analysis and IT to at least some extent. This, combined with my academic background in statistics, has helped me contribute to the operations and long-term goals of the CAS.
- What is your favorite hobby outside of work?
I play guitar and love to bike on Northern Virginia’s outdoor trails. My goal this year is to bike the entire length of the Washington and Old Dominion Trail, from Alexandria to Purcellville (almost 45 miles).

- If you could visit any place in the world, where would you go and why?
When I get the chance, I’d really like to visit Greece, especially Crete. The history of the country has always fascinated me, and the food is a plus too!
- What would your colleagues find surprising about you?
In college, I volunteered for an anonymous student-run mental health support and referral hotline. I never studied psychology or social work formally, but the training I received and experience I gained from my two years with the line have really helped me understand the topic more thoroughly.
- How would your friends and family describe you?
People know me as someone to come to if you need a tidbit of knowledge or trivia about absolutely any topic, from history to literature to science. I read a lot, and it really helps me clean up at quiz bowl and trivia nights!
2025 Annual Report of the CAS Discipline Committee Released
he CAS Rules of Procedure for Disciplinary Actions (as amended May 3, 2009, by the CAS Board of Directors) requires an annual report by the Discipline Committee to the board of directors and to the membership. This report shall include a description of its activities, including commentary on the types of cases pending, resolved, and dismissed. The annual report is subject to the confidentiality requirements.
The CAS Discipline Committee received a complaint in February 2025 alleging possible material violations of Rules 1 and 2 of the Code of Professional Ethics for Candidates by a CAS actuarial candidate. An investigation panel was convened; its report was issued at the end of August 2025 and recommended discipline. In accordance with the CAS Rules of Procedure for Disciplinary Actions involving Candidates, a Discipline Committee Panel was convened and held a hearing in November 2025 to review the recommendation and record provided by the investigation panel and to render a decision on discipline.
The Discipline Committee Panel unanimously concluded that the subject candidate materially violated Rules 1, 2, and 7 of the CAS Code of Professional Ethics for Candidates and concluded that a significant restriction on the subject candidate’s CAS exam eligibility was warranted. The Panel therefore ordered that the subject candidate be barred from taking future CAS examinations and that the subject candidate may be allowed to take future CAS examinations only upon their request to, and approval by, the CAS Discipline Committee.
This decision is final and binding as the subject candidate did not appeal the decision.
There were no cases pending before the committee as of the date of this report.
January 19, 2026
CAS Discipline Committee Panel Issues Ruling
he Discipline Committee Panel of the Casualty Actuarial Society (CAS), acting in accordance with the CAS Bylaws and the CAS Rules of Procedure for Disciplinary Actions Involving Candidates, and with consideration of the findings and recommendation from the CAS Investigation Panel, voted unanimously to bar Amy Tau from taking future CAS examinations for materially violating Rules 1, 2, and 7 of the Code of Professional Ethics for Candidates (the “Candidate Code” or “Code”).
The Panel found that Ms. Tau materially violated Rules 1 and 2 by misrepresenting that she sat for a CAS examination, knowingly submitted false time entries to her then employer to make it appear as if she was sitting for a CAS examination when she was not, and altering a prior CAS grade report that she then provided to her employer. Additionally, Tau failed to respond to the investigation inquiries and did not respond or appear for the Discipline Committee Panel hearing, materially violating Rule 7 of the Candidate Code.
Tau may be allowed to take future CAS examinations only upon her request to, and approval by, the CAS Discipline Committee.
The appeal period has expired without appeal, and the Panel’s decision is final.
Celebrating the 2025 CAS Volunteer Award Winners
ach year, thousands of CAS volunteers contribute their time, expertise, and energy in ways that strengthen our profession and support members at every stage of their careers. The 2025 Volunteer Award recipients represent the many paths through which volunteers make a difference — from education and research to engagement, leadership, and community building. As National Volunteer Week approaches, running from April 19 to April 25 this year, it’s the perfect time to spotlight these inspiring volunteers.
What follows are reflections shared directly by many of this year’s honorees, along with profiles highlighting the service and impact of others, all of which showcase the passion, commitment, and collaborative spirit that define CAS volunteerism.
New Member Award
Don’t be afraid to ‘shop around’
Jessica Ackley, ACAS 2022
“I always say that I volunteer for the CAS because so many of the people closest to me are actuaries, and I want to provide the varied perspectives of everyone I know and do what I can to help improve things. My husband is an FSA, my younger brother recently earned his ASA, two of my very best friends are an FSA and an FCAS, and I still see many of my college friends (actuarial science majors) regularly. I joke that I can’t seem to get away from actuaries. I joined a small triathlon club a few years ago and, after a few workouts, found out that one of the women was an FSA.

Ackley
“I really enjoyed writing an article in Future Fellows last spring that covered details on how the PCPA transition deadline would work. Based on the conversations we were having while I wrote the article and questions that I raised, the deadline changed to January 1, 2026, and we were able to make the transition timeline a bit smoother for candidates. I felt like the article was a really helpful resource for candidates and employers as they navigated the change.
“Don’t be afraid to ‘shop around’ a bit regarding volunteering; all of the CAS groups I’ve volunteered with have a different structure and feel to them. If you join a group and don’t feel like it’s a good fit for whatever reason, try a different group when the next volunteer survey rolls around.
“Since I’m in the Candidate Advocate Working Group, please tell the candidates you know to keep an eye out for the Candidate Survey coming out later in 2026. The survey results are intended to directly influence the priorities of our group and other groups in the CAS.”
Just jump in
Josh Meyers, FCAS 2023
“What I enjoy most about volunteering is the chance to connect with people throughout our profession. Working on the CAS AI Fast Track gave me the opportunity to talk to actuaries from all over who are helping push the profession forward. When I worked with an exam committee, I spent several months with the same group, and it was great to build relationships with people I never would have crossed paths with otherwise. Getting to meet and learn from so many different people has been the most rewarding part of volunteering for me.

Meyers
“I’m going to pass along the same advice I saw in the Actuarial Review a few years ago: Just jump in. There are so many ways to volunteer with the CAS, and you do not need to have it all figured out at the start. There are also plenty of opportunities to start small with just an hour or two each week. Try a few different things and see what works best for you.
“Do not be afraid to reach out and talk to the CAS staff. I have worked with staff across the organization, including people who design exams, organize events, and support continuing education, and every one of them has been friendly and great to work with. Even if there are no volunteer opportunities listed, reach out and ask what is in the works. They are always happy to help you get connected.”
Find your passion and give it your best
“Volunteering for the CAS has been a great learning experience, whether by doing my own research to write various articles or from discussions with other CAS volunteers who are quite accomplished, and I consider them thought leaders in the field. Writing is also a skill I’ve been meaning to cultivate, so volunteering with the CAS has given me the opportunity to develop this skill and get feedback from professionals to help my career growth.

Nawar
“When I started volunteering with the CAS, I was impressed by how motivated, engaged, and dedicated everyone is. While brainstorming with Jim Weiss on the thesis of one of my papers, we spent over an hour slicing and dicing all the arguments until we were able to come up with a great conclusion. I got very motivated having this discussion, especially with someone as brilliant as Jim. When my colleagues and friends come to me asking questions about my ideas, it’s quite rewarding.
“Find a working group whose mandate is something you’re passionate about and then give it your best. It’s a very rewarding experience and I’m lucky to be part of the Actuarial Review Writing Subgroup.”
Rehan has been a driving force in expanding the CAS’s influence and leadership on the global stage. Through his work as vice chair of the International Actuarial Association Climate & Sustainability committee and as an active member of the CAS Climate and Sustainability Working Group, he has helped raise the Society’s profile on climate and sustainability topics among international peers.

Siddique
Above and Beyond Achievement Award
Passion is contagious
Louis-Philippe Caron, FCAS
“As a person and an insurance professional, I always believed in the importance of personal and professional growth, networking, and giving back to the community and the industry that has shaped my career. Serving not only allows you to volunteer your expertise and time to support an organization but also benefits you personally and professionally. It is a transformative opportunity to build your skills in new areas, work on projects you ordinarily do not have the chance to, and build new connections with professionals in your industry and beyond. Building on my passion for advocating and contributing to my community and our profession is and has been an ongoing source of fulfillment and happiness for me.

Caron
“What stands out to me is how passionate and determined the great majority of volunteers are. That passion is contagious and helps the teams deliver better outcomes together; the group is always better than the sum of the individuals.
“As a co-lead of the Future of Volunteerism Task Force, I strongly advocated for the shift to a more balanced staff and volunteer model with better defined accountabilities and objectives. I am very happy with the recent evolution of the CAS and am convinced that we have put in place the right model to accelerate our growth and ensure a better future for all stakeholders.
“You are never too young or inexperienced to start your giving back journey. Go at your own pace, given the time that you have; small is beautiful. Micro-volunteering is a great way to get your feet wet and to start your CAS volunteering journey.
“Get involved. You will never regret it. It will be rewarding on both a personal and professional level.”
“I volunteer for the CAS because I care deeply about the profession and the people in it. The CAS played a huge role in my own development, and volunteering is my way of giving back while helping shape what comes next. I’m energized by collaborating with passionate volunteers and staff to create meaningful education, promote professionalism, and build a community that supports actuaries at every stage of their careers.

Huenefeldt
“Incidentally, many of my favorite volunteering memories involve karaoke, which may or may not say something about me! From belting out songs in Vegas with fellow facilitators after the Course on Professionalism, to karaoke nights at the CAS Leadership Summit with volunteers and staff, to heading out with friends after speaking at CLRS or the Annual Meeting — those moments always rise to the top. They’re a reminder that while the work we do for the CAS is important, the friendships, laughter, and occasional off-key singing along the way are what make volunteering truly unforgettable. (And in case anyone was wondering, my go-to karaoke song is ‘Total Eclipse of the Heart’ by Bonnie Tyler.)
“What I’m most proud of in my volunteering is helping move meaningful professionalism initiatives from idea to execution. During my leadership roles with the Professional Education Working Group, I had the opportunity to help expand the Course on Professionalism to better reflect the skills actuaries need in practice, most notably incorporating communication skills in 2019.
In 2020, when the pandemic disrupted in-person courses, we quickly pivoted to create a virtual option so candidates could continue progressing toward their credentials without interruption. More recently, when bias topics were added as a requirement to the U.S. Qualification Standards, we developed content to ensure candidates could meaningfully fulfill that requirement. Together, these efforts helped keep professionalism education relevant, accessible, and aligned with the evolving expectations of the profession.”
Collaborating benefits the CAS and my job
Jamie Mills, FCAS
“The actuarial career has given me so many opportunities to grow, learn, and do meaningful work. Volunteering is my way of giving back, to help create similar opportunities for others entering or advancing within the profession.

Mills
“For each of the committees I’ve had the privilege of leading, I have always been impressed with the engagement and drive of the committee members. It’s inspiring to witness the engagement and passion of the volunteers, and it emphasizes what all we can accomplish when we bring a great group of actuaries together with a common goal.
“I’m incredibly proud of how engaged and collaborative our Ratemaking, Product and Modeling Seminar Working Group is. Everyone is genuinely committed to putting on a world-class seminar, and the teamwork makes the process both productive and enjoyable. The relationships we’ve built along the way are a big part of what makes the experience so rewarding.
“My recommendation to new members is to find something that interests them and that they are passionate about. Being engaged from the start will serve you and the CAS well and will help you on your volunteering journey.”
Creating a meaningful forum
Terence “Terry” Richard Robinson, ACAS
Posthumous Award Recipient Terence (Terry) Richard Robinson was a dedicated CAS volunteer, respected colleague, and deeply engaged member of the actuarial community whose impact continues to be felt across the Society. Terry passed away unexpectedly in December 2024. He served as chair of the Reinsurance Working Group within the Research Council.
Terry began volunteering shortly after earning his ACAS in 2013. He had remained actively engaged until just days before his passing. Over more than a decade of service, he held numerous leadership and volunteer roles, including four years as chair of the Reinsurance Working Group and service as a University Liaison with Temple University, where he earned his actuarial science degree. As chair of the Reinsurance Working Group, he was passionate about ensuring the working group served as a meaningful forum for strengthening actuarial knowledge and advancing reinsurance research.
Known for his intellectual curiosity and generosity with his time, Terry was a steady and enthusiastic contributor to CAS research initiatives. Even in his final days, he remained focused on supporting a research project, reflecting his deep commitment to the profession and the Society. He also had an active presence on LinkedIn, where he shared insights with a wide professional audience and helped extend CAS conversations.
Professionally, Terry was an assistant vice president at Old Republic Specialty Insurance Underwriters and previously worked at JLT Towers Re, Guy Carpenter, and Towers Watson. Beyond his actuarial work, he was a person of eclectic interests and talents — an Eagle Scout, writer, photographer, performer, and co-host of “Mage: The Podcast.” He lived by a principle he often quoted after acts of generosity: “A Scout is helpful.”
Terry is remembered for his warmth, curiosity, and ability to connect people across disciplines. This award honors his lasting contributions to the CAS and the generous spirit with which he served the actuarial community.
Becoming a better actuary
Jaris Wicklund, FCAS
“I’m very proud of being a member of the CAS, and I want to help ensure it becomes the best organization that it can be. The vast majority of my volunteering to-date has been in the area of university engagement. The future of the CAS is dependent on finding, attracting, and educating the next generation of members, and I have always been passionate about being involved in these efforts.

Wicklund
“I think the thing I am most proud of from my time volunteering so far is helping craft the initial CAS Student Central Summer Program. In 2020, a large number of students had internships canceled, and a small group of us were challenged to create something to fill that gap. I think we built a truly meaningful and valuable experience for those students in a very short time, and I’m really proud of how we all pulled together to make it happen. That program has become a pillar of the CAS’s offerings to university students, and I am proud to have had a hand in creating it.
“Lean into what you are passionate about. There are a wide variety of volunteer opportunities from research to engagement to exam writing to finance and investments. Anything you are interested in, I am certain there is a volunteer opportunity for you. Please feel free to reach out. I would love to connect and learn more about what you are passionate about!”
Strengthening CAS ties with Asia
Janet Yang, FCAS
Janet Yang has long been a dedicated volunteer for the CAS and a passionate advocate for the actuarial community in Asia. Her service began with significant contributions to the CAS Exam Committee in Canada and has continued with sustained impact since relocating to Hong Kong. Yang has worked tirelessly to strengthen CAS’s visibility and engagement in the region, fostering collaboration across local actuarial organizations and serving as a key liaison for CAS activities.
Through her involvement with Asia Region Casualty Actuaries (ARECA), she helped restructure the ARECA Scholarship and secure sponsorship for its inaugural case competition — initiatives that have meaningfully advanced student engagement. She regularly leads CAS information sessions at universities in Hong Kong and contributes to professional education programs across the region.
Building on this extensive volunteer experience, Janet Yang has recently taken on the role of president of ARECA, where she will continue to expand member engagement, facilitate conferences and university outreach, and deepen connections with actuarial partners across more than a dozen markets.
Matthew Rodermund Memorial Service Award
Challenge the status quo
Sean McDermott, FCAS
“Years ago, I would have replied with the typical ‘to give back’ answer. Now, many years later, I volunteer to stay connected, maintain old friendships, meet new people, and stay relevant.

McDermott
“Over the years, I have watched the CAS team grow, and I have many fond memories and valuable CAS staff friendships.
“I was on the Executive Council during the CAS/SOA merger discussions and in the room for the final decision. This was an interesting time to be part of the CAS leadership, and the memories of the meetings/discussions will always be a highlight.
“I am proud of the support of my family during my years as a CAS volunteer. During certain times, the CAS volunteer commitment required additional travel that was added to an already busy work life and travel schedule. We made it work! The advice is simple. Just start!
“Pick a committee that interests you and look for ways to improve the committee’s process and create valuable changes to the tasks at hand. Do not be afraid to challenge your committee’s status quo or long-term embedded processes. You are on your committee to lead and make intelligent changes. Change is good!”
Lifelong friendships are invaluable gifts
Jim Merz, FCAS
“I feel that I have gained so much from being a member of the CAS that it is my obligation to give back to the community. It is fulfilling to feel a sense of accomplishment when working with other like-minded professionals for the good of the Society.

Merz
“One of my fondest CAS memories is the celebration dinners when I first joined a grading committee. There was a sense of accomplishment and joy to have worked hard to get the exams graded and pass marks set.
“I am most proud of the variety of types of volunteering and the length of continued service. Try volunteering because you might find that you like it!”
On behalf of the entire CAS family, we are grateful to all our volunteers who make a difference each year!


Printing Property: The Risk and Opportunity in a 3D Printed World
he year is 2025, at a time when the majority of us haven’t been on a 3D printing construction site. How would a building be 3D printed? How does 3D printing work?
I want you to visualize the process of soft serve ice cream at a fast-food restaurant. The premixed ice cream is dispensed from a metallic head at a constant speed, while the server skillfully maneuvers his hand, circling the cone while lowering the position as the ice cream builds on top.
This analogy is in essence how 3D printing works: a malleable substance being dispensed layer by layer into specific shapes. In the ice cream example, the shape is a cone, and in the 3D printing building example, it is (usually) a vertical wall slab. One fundamental difference between making soft serve and printing a building lies in the relative locations of the dispenser and the nozzle. For the soft serve, the nozzle — the metallic head where the substance is dispensed — stays static, while the receiving cone makes the movement, calibrated to achieve the desired diameter, height, and shape. For the large-scale 3D printed building, the site stays static while a giant nozzle controlled by a 3D axis system conducts the movement, drawing a smooth line with premixed concrete, tracing along a predetermined path that over time, in a sedimentary manner, will become a monolithic mass.
Background
With the same 3D print job file, you can print from anywhere and from any machine, as long as it’s professionally calibrated with any kind of printing materials, ranging from corn-derived polylactic acid to highly engineered concrete, and at any scale, from a desktop miniature to a civic building block. The loss in translation of the geometry is minimal due to the coded pathway that dictates how it prints. With a 3D printer, you are free from the limit of having the expertise onsite, with no fear of miscommunication across teams or loss of information in the transition and translation between platforms.
Overall, the scalability, duplicability, and humanless features make 3D printing extremely appealing to both investors and innovators around the world. Venture capitalists from San Francisco are funding start-ups in Texas (and other places in the U.S.2), while higher education institutions in the Netherlands3 and Switzerland4 are releasing groundbreaking innovations that make the technology more powerful every day.
As investors and innovators are making plans for expanding the endeavor, the insurance world has been relatively quiet on the subject. The aim of this article is to unpack this technology and initiate a discussion of the opportunities and risks of 3D printing as a construction method, especially as it impacts the property insurance market.
Buildings and insurance
While it was not discussed during the session, I wondered if this lack of synergy and urgency comes from the segregation among experts from different industries.
The evidence displayed at an actuarial conference for some building materials being safer than others is clear and sound. However, when it comes to choosing building materials, insurers don’t have much leverage to make the builder choose the construction materials. The risk profile of a building is determined by the design (the architect), the construction (the contractors), and the price (the suppliers). By the time the underwriter or the actuary is involved in the project, it’s too late. It usually isn’t until the house is near completion that the homeowners start to shop for insurance policies. Homeowners are also learning too late that they could have made different decisions that would have affected their coverages and prices.
When the major insurers in California withdrew from the homeowners market, it was largely due to the uninsurability of the houses in the wildfire-prone areas.6 Among the corporate evacuees, we see a strong trend among decisions made from 2021 and onward. Many major firms stopped issuing new policies, and some stopped renewals of property coverages in California. Many quoted the reasons being the increase in cost of construction and inflation.6
If the houses being built are too expensive to repair and replace, the conflict between insurance and construction boils down to the conflict between insurability and housing shortage. Both sides are doing what they have to do: insurers exit the market because it need to stay solvent; homeowners build in undeveloped wildfire-prone land because they run out of places to build.
When 3D printing enters the room
While investors and innovators are celebrating the cost efficiency and high fidelity of 3D printing buildings, insurers and regulators may find themselves advocating for this particular fabrication method for their own reason — risk reduction.
3D printing material for buildings is primarily concrete with reinforced rebars. Much like traditional concrete buildings, the material has similar fire resistance performance and isn’t easily destroyed by heat or smoke.7 A commercially available 3D exterior wall is claimed to have “a fire resistance rating of more than 2.5 hours per ASTM E119 and interior walls have a fire resistance rating of 117 minutes.”8
Apart from the reduced property damage side of the advantages, a 3D printed building may also eliminate certain liability risks during the construction process. Due to the minimal number of human workers on site, the insurance exposure is foreseeably reduced. The type of work is also much less risky than traditional construction, since humans are eliminated from tasks involving heights, heavy weights, or falling items. The most common task is to monitor the printing process, and the most likely injury risk is probably reduced to sunburn. Jokes aside, the cost of savings in workers’ compensation for developers and investors can be a significant incentive for the adoption of 3D printed buildings.
Another aspect, which is not directly linked to risks but should add more credibility to this construction method, is that it can be used for building. Since a printer can operate autonomously in conditions with unfavorable temperatures and no oxygen, governments and large tech companies are investing in experiments and projects to send printers to the moon to accomplish a task that is impossible for human astronauts to do.
The dark side of the moon

Because it’s printed from a refined nozzle and geometries are calibrated and optimized, a 3D printed wall will use significantly less concrete, making it more affordable and easier to construct than traditional concrete buildings. However, the reduced thickness increases the risk of brittleness, especially in terms of wind or earthquake resistance, but the actual impact will require more refined research.
Resistance against lateral force is another concern. Typically, current 3D printing technology fabricates in a sedimentary manner, producing layer after layer of material on a horizontal plane. To visualize this, recall the earlier soft serve ice cream analogy. What happens if your soft serve is built too high? It falls over, and you have less ice cream to enjoy. With sedimentary layers, tolerance of lateral force is weak. A 3D printed concrete wall is not as strong as a conventional concrete one, which has reinforced rebar that goes in both horizontal and vertical directions. To overcome such a shortfall, a comprehensive structural system is needed. Because of this weakness, existing 3D printing projects generally don’t exceed two floors because they lack reinforced vertical stability.

Risks aside, the technology itself has some hard thresholds to overcome. The 3D printing process is not strictly human less in any practical sense. The initial file creation requires an extremely high level of expertise. Knowledge about 3D modeling and the building’s construction are essential. Adding industrial experts to the staff of architects and designers will add costs to the project. Additionally, the starting stage of the actual printing process demands rigorous calibration, a process that takes in depth knowledge of the machine, as well as experience in troubleshooting. Most printing job failures occur at the beginning: rough or uneven platforms can jeopardize the rest of the print.
Once the file is created and the machine is calibrated, the rest of the process doesn’t involve a human’s touch. The general practice on a 3D printing site usually requires one engineer to “supervise” — that is, watch the printer in case anything abnormal happens: nozzle blockage, irregular extrusion of material, missing layer (due to nozzle blockage), etc. Such supervision is instrumental, especially for an open-air printing job (i.e., not in a controlled environment), and a mistake is consequential — it usually means hours of work and printed material is wasted, and if not caught early, the job may need to be restarted.
Speculation
Companies like ICON and Vertico are generating useful data and rapidly expanding the applications of 3D printing construction. Such total digitalization will change the landscape of data collection and analysis. We will have more accurate exposures, more timely reports on damage and cost, and more precise correlations between exposure and loss. It’s not science fiction that in a few years many of our constructions can be 3D printed, whether it’s motivated by cost saving, fireproofing, or the intricacies of construction. It’s our responsibility as risk professionals to understand what is coming toward us.
At a time when professionals are highly specialized in their own field, it’s unconventional and challenging to look at problems from other industries. I’ve seen amazing research done in vertical fashion, but it’s also important to look at problems horizontally. As insurance professionals, being curious about tangential knowledge that’s traditionally outside of our expertise will empower us to advocate for choices that serve us better collectively and will generate more synergy across boards. Collaboration and communication are the keys to open up solutions and new horizons for our field.
References
- History of 3D printing: It’s older than you think
- ICON, a pioneer in the 3D printing of homes, raises $56M led by Norwest, Tiger Global
- Vertico News
- Mechanics and Materials Laboratory — 3D Printing
- Wildfire Prepared: Practical, Proven Steps to Safeguard Homes and Communities, Alister Watt, CAS Annual Meeting, Austin, TX
- References:
- Fire performance of innovative 3D printed concrete composite wall panels — A Numerical Study, Thadshajini, Perampalam Gatheeshgar, Irindu Upasiri, etc.
- ICON Wall performance
- ICON Build — Story
Surface Tension
loods rarely arrive the same way twice. Some are driven by hurricane-induced storm surge that pushes seawater inland block by block. Hurricane Harvey behaved differently, hovering over the Gulf Coast for days and dropping feet of rain on Houston. Sometimes a river slowly exceeds its banks after days of steady upstream rain, and sometimes it rises with extraordinary speed after heavy localized rain, as was seen in the tragic Kerr County, Texas, event in 2025. And increasingly, it’s none of those things; instead, we’ve seen intense cloudbursts overwhelm streets, basements, and storm drains in places that don’t think of themselves “flood-prone” at all.
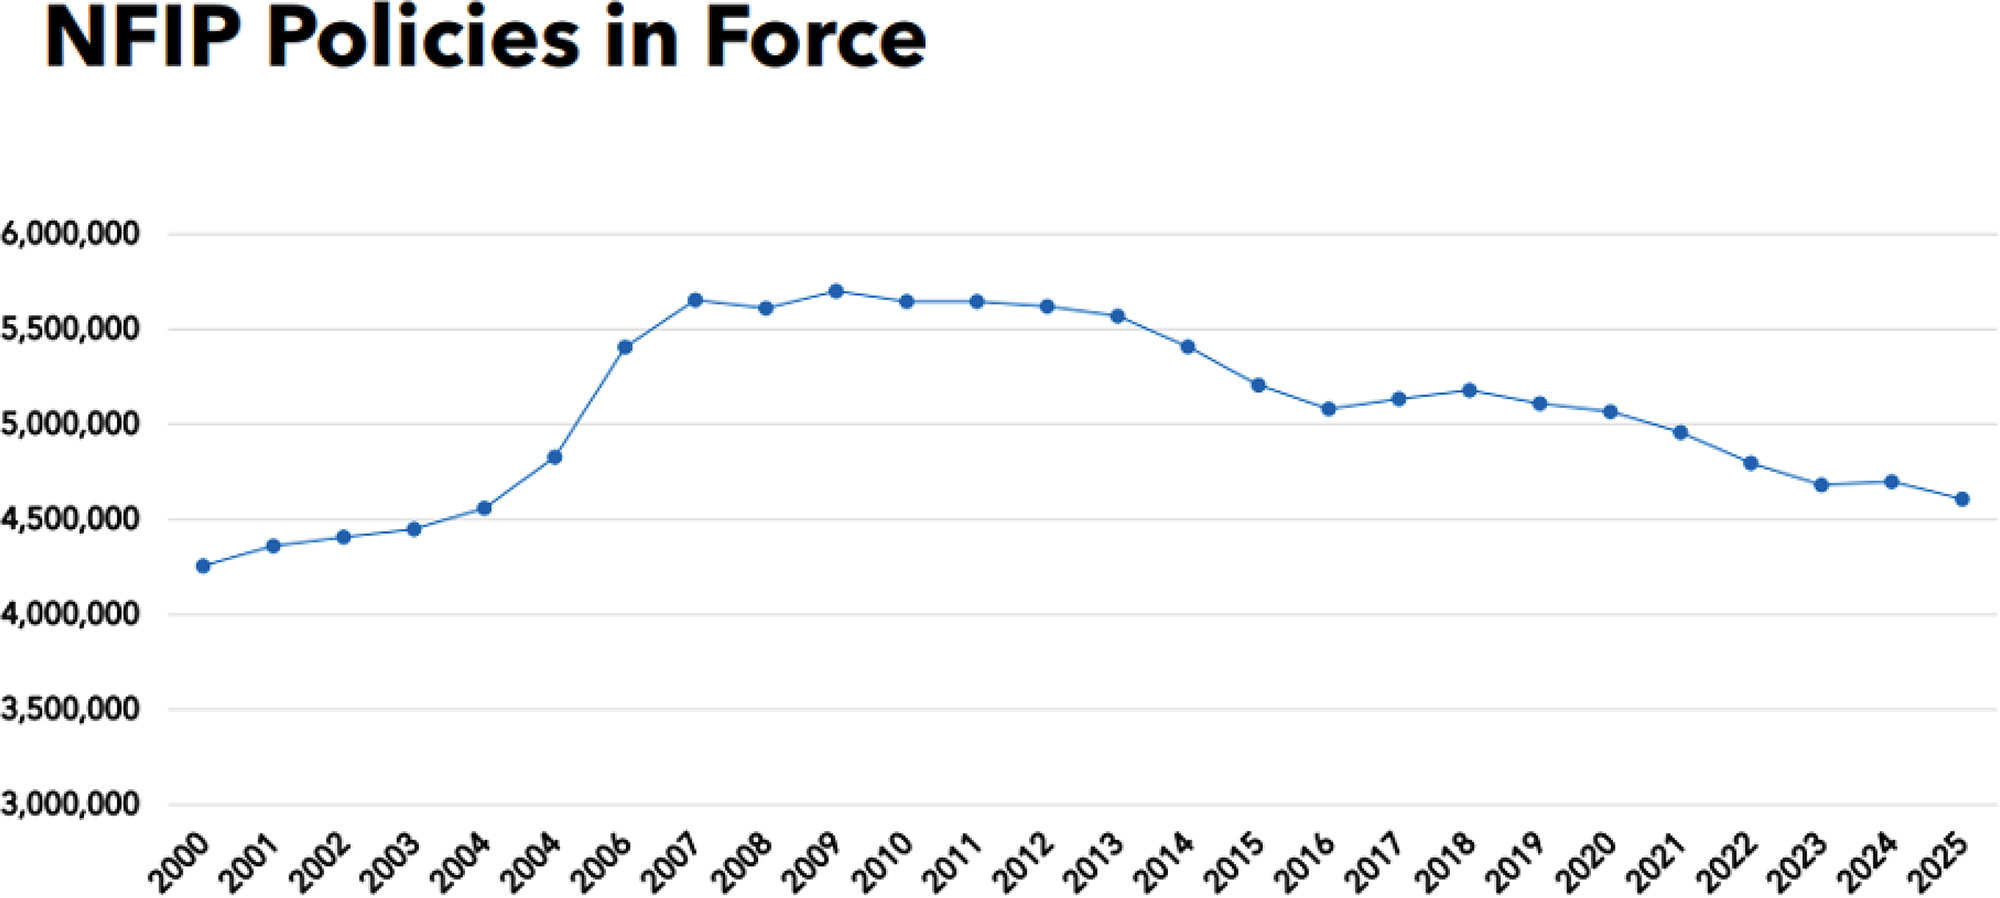
Insurance coverage has failed to keep pace with this growing risk. Most households affected by inland or urban flooding still have no flood insurance at all, even after experiencing losses firsthand. This coverage gap is no longer a mystery of modeling. Flood risk today is better measured, more granular, and more legible than at any point in the past; both public and private actors can estimate property-level exposure with a degree of confidence that would have been unthinkable a generation ago, and modeling breakthroughs continue to accelerate. And yet uptake remains stubbornly low, especially outside the narrow slice of properties where coverage is mandatory.
That tension — between rising, increasingly visible flood risk and persistently limited insurance coverage — is the starting point for this article. Private flood insurance has finally become viable, supported by new models, new capital, and new regulatory pathways that barely existed a decade ago. But viability is not the same as reach. Without changes to how flood insurance is distributed, incentivized, and embedded into household decision-making, private flood will remain a niche solution: well designed and technically impressive, but still absent when people need it the most.
“Flood” is not just one peril
Coastal storm surge is the version of flood risk most people picture most readily. It is driven by wind pressure pushing seawater inland. Losses tend to track familiar geographies: barrier islands and low-lying coastal plains. The footprint can be large, but the risk is legible — people know they live “near the water.”
Fluvial (riverine) flooding is less intuitive because it is a system problem. A property can flood because of rainfall miles away, hours or days earlier, interacting with soil saturation, upstream development, and watershed geometry. River floods also span a spectrum: some are slow and forecastable, while others behave like flash floods when intense rain falls over a narrow area and channels fill faster than warnings can travel, trapping communities.
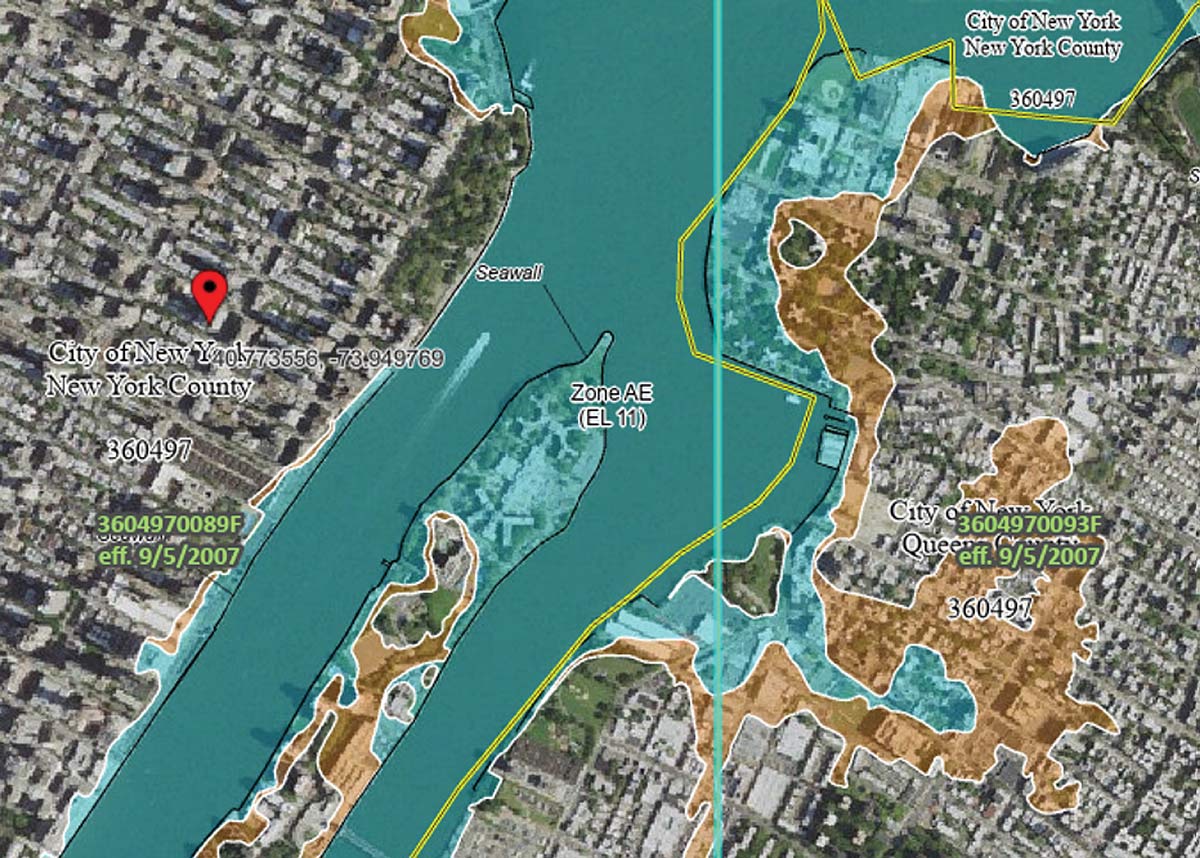
These differences make flood risk patchy and, in many places, invisible. Public understanding and many institutional triggers still anchor on binary categories, like being inside or outside of a Special Flood Hazard Area (SFHA), defined as having a greater than 1% annual chance of flooding. But much of today’s damaging flood experience does not respect those boundaries. The consequence is a persistent mismatch: households and mortgage lenders often treat flood as a niche coastal or river-adjacent concern, while losses increasingly reflect a wider set of mechanisms and geographies. That disconnect helps explain why flood insurance institutions have struggled to adapt.
How flood became a federal problem
This retreat coincided with a shift in how flood losses were handled politically. Large floods increasingly triggered federal disaster aid, infrastructure spending, and emergency relief. That response helped communities recover, but it also weakened the case for voluntary insurance. Flood risk, in practice, became socialized ex post rather than pooled ex ante, and this continues to be the case today.
The modern framework took shape in 1968 with the creation of the National Flood Insurance Program (NFIP). The NFIP was not designed simply to replace private insurance. It was built around a dual mandate that remains central to its identity. First, it aimed to make flood insurance broadly available in places where private markets would not operate. Second, it sought to reduce future flood losses by tying insurance availability to community floodplain mapping, land-use controls, and mitigation standards adopted by local governments.
The program’s delivery mechanism reflected this hybrid role. Under the “Write-Your-Own” (WYO) structure, private insurers sell and service NFIP policies under their own brands, while the federal government retains the underwriting risk and sets rates and terms. The arrangement leveraged private distribution and claims infrastructure without requiring insurers to put capital at risk. That structure has long created incentive frictions: flood is an administrative line rather than a strategic one, offering limited upside for insurers or agents, little reward for risk reduction, and few reasons to actively promote coverage outside mandatory purchase scenarios.
From the outset, the NFIP was asked to balance competing goals that would be difficult for any institution to reconcile. It was expected to be financially sound, politically palatable, widely available, and supportive of long-term risk reduction — all while operating in places where flood risk was highest and mitigation most expensive. That tension has shaped the program ever since, and it continues to influence how flood insurance is perceived today.
The NFIP today
The most visible expression of that shift is Risk Rating 2.0, FEMA’s overhaul of how flood risk is priced. Rather than relying primarily on broad flood zones and elevation thresholds, the updated framework incorporates multiple catastrophe models, property-level characteristics, and a wider set of flood risk drivers. The result is a rating system that produces far more differentiated premiums and aligns more closely with expected loss than its predecessors ever could.
Importantly, the NFIP’s modernization did not rely on a single model or vendor. The NFIP now blends multiple model views, empirical loss data, and portfolio considerations in ways that resemble best practices in the private market. Evans notes that while the NFIP has guardrails, “within the constraints it has it is now a pretty sophisticated pricing approach.”
Those constraints, however, remain substantial. Rates are subject to statutory caps and glide paths that limit how quickly premiums can adjust, even when updated risk signals point sharply upward. Coverage limits of $250,000 for residential and $500,000 for commercial are increasingly inadequate relative to replacement costs in many markets. In addition, the requirement for mandatory purchase of flood insurance is still tied to SFHAs, anchoring participation to legacy flood maps even as a growing share of losses occurs outside those zones. The result is a program that can assess risk with increasing clarity but cannot fully act on that information.
Private flood reemerges
Computing power eventually caught up. Katz describes how, by the early 2010s, “computers were finally getting fast enough that you could start to do this nationally and give carriers confidence in the results.” At the same time, data inputs improved dramatically. High-resolution elevation data, land-use and land-cover datasets, and better precipitation modeling allowed modelers to approximate surface runoff, ponding, and drainage behavior in ways that had previously been infeasible.
Those improvements mattered most outside traditional floodplains. In many areas classified as low risk under FEMA’s mapping regime, pluvial flooding dominated loss experience. Cities like Atlanta — where Katz notes there is no major river running through the city — were systematically underestimated, despite topography and development patterns that funnel water into vulnerable areas.
Equally important was the ability to translate model output into underwriting signals insurers could actually use. As Katz puts it, the breakthrough was not just better hazard science, but the ability to run models consistently, compare results across vendors, and integrate them into rating and underwriting workflows. Once that became possible, flood stopped being an unquantifiable tail risk and became something insurers could segment, price, and manage.
Regulatory changes removed the next barrier. When private flood policies were allowed to satisfy mandatory purchase requirements for federally backed mortgages, the market shifted from theoretical to viable. Without that recognition, private flood could only function as an excess or voluntary product. With it, insurers could compete directly for primary coverage, particularly for properties where NFIP pricing or coverage limits no longer aligned with perceived risk.
Capital followed these capabilities. As modeling improved, reinsurers grew more comfortable deploying capacity to flood programs — often with close scrutiny of accumulation management and underwriting discipline. A new ecosystem of MGAs, specialty carriers, and reinsurance-backed programs was thus able to grow.
The private flood market that has emerged over the past decade is no longer hypothetical. A recognizable set of players and business models now demonstrates that flood insurance can be written, priced, and supported at scale. What the market has not yet demonstrated is how to translate that technical viability into broad adoption.
At the center of the market are specialist MGAs that have made flood their primary focus. Neptune Flood is the most prominent example, having built a national primary flood product that competes directly with the NFIP in many regions. Neptune’s growth — and its headline-grabbing 2025 IPO — validated the basic proposition that private flood could operate beyond narrow excess layers.
Reinsurers, meanwhile, have moved beyond passive capital provision. Firms like Swiss Re have developed increasingly integrated flood solutions for primary carriers and MGAs, combining modeling, pricing support, accumulation management, and quota share capacity. But as Evans emphasizes, the goal is not to make flood permanently “risk-free” for insurers. “Some companies see the value in flood but don’t want it on their balance sheet yet,” he noted. “If flood is going to become common, some insurers are going to have to retain the risk over time.”
In practice, that often means heavy quota share structures early on, paired with an expectation that insurers will gradually take on more exposure as confidence builds. “There isn’t a lack of flood capital,” Evans observed. “There’s a lack of insurers willing to make this a priority.” End-to-end reinsurance solutions can lower barriers to entry, but they cannot substitute for carrier commitment.
Despite this activity, the shape of growth remains telling. Much of the private flood market has expanded by serving risks that are already relatively well understood and economically attractive, such as homes exceeding NFIP coverage limits, properties near mapped floodplains, or policyholders reacting to premium increases. In many cases, private policies substitute for NFIP coverage rather than materially expanding the number of households insured. That dynamic was especially visible following Risk Rating 2.0, when pricing dislocations temporarily accelerated private-market growth before trends normalized.
The challenge facing private flood insurers today is therefore not underwriting or capital. Those problems are largely solved. The harder problem is scale — making flood insurance a routine purchase rather than a reactive one. That requires solving distribution: bringing coverage to the point of sale, aligning agent incentives, and rewarding market expansion rather than selective participation. The private flood sector will remain limited if it is built primarily on cherry-picking around the NFIP or grabbing growth when NFIP funding halts, as it did during the recent 2025 federal government shutdown. One that succeeds in broadening participation could begin to close the persistent gap between flood risk and flood coverage.

Flood insurance at the confluence
The NFIP was never meant to operate as a purely commercial insurer. Its mandate extends beyond risk transfer and into floodplain management, mitigation standards, and land-use signaling — an explicitly political choice to sustain communities in flood-prone areas. Private flood markets, by contrast, are built to price and select risk, not to regulate development or preserve broad access to coverage. Without a public backstop, underwriting and pricing would render large parts of the country effectively uninsurable. The result is that the NFIP and private flood are complementary rather than competing substitutes. The former provides baseline availability and policy structure, while the latter offers flexibility and capacity where underwriting confidence is strongest. The danger lies not in overlap, but in imbalance — where private insurers concentrate on economically attractive risks, while the NFIP increasingly absorbs the most difficult ones.
The U.S. flood insurance system is now approaching a genuine inflection point. The technical barriers that once constrained both public and private markets have largely fallen away. Risk is better measured, capital is available, and multiple operating models have proven viable. What remains unresolved are institutional choices about distribution, mandates, and risk sharing that will determine what kind of market ultimately emerges.
Broadly speaking, there are only a few plausible paths forward. One is continued drift: private flood grows largely through substitution, while the NFIP increasingly absorbs the most difficult risks and functions as a deeper residual market. Another is market-led expansion, in which bundling, embedded distribution, and carrier commitment make flood insurance routine in low- and moderate-risk areas, with the NFIP remaining central but less dominant. A third, more politically challenging path would involve changes to mandatory purchase or disclosure regimes that more explicitly treat flood as a shared household risk rather than an optional add-on.
None of these outcomes is preordained. But the direction taken will depend less on further modeling breakthroughs than on whether insurers, regulators, and policymakers can align around expanding participation rather than merely reallocating existing demand.
Regulators are already responding to this transition. State insurance departments and national bodies like NAIC have increased their attention, focusing on consumer clarity, solvency, accumulation risk, and model governance as more flood exposure moves outside the NFIP’s direct purview. The aim is not to slow innovation, but to place guardrails around a market that is still finding its footing.
Even with better oversight and better products, however, the central challenge remains unresolved: flood insurance is still treated as optional. It is rarely bundled with homeowners coverage, rarely presented clearly at the point of sale, and rarely revisited absent a lender mandate or recent loss. Mandatory purchase requirements, narrowly tied to SFHAs, capture only a fraction of today’s risk. Outside those zones, participation depends on individual initiative, an approach that has repeatedly failed to produce meaningful risk pooling. Until flood is treated as a core household risk rather than a specialty add-on, uninsured losses will continue to be borne largely by homeowners themselves.
Sources
- Congressional Research Service, Private Flood Insurance and the National Flood Insurance Program.
- NFIP’s Pricing Approach.
- NAIC 2025 Fall National Meeting Climate and Resiliency (EX) Task Force Meeting Slides.
- Jencap Flood Insurance Trends Approaching 2026.
- Insurance Information Institute, Spotlight on: Flood Insurance.
Developing News
The Rise (and Perils) of AI Summaries in Search Engine Results

he prevalence of AI-generated summaries within search engine results has increased dramatically over the past two years. An ongoing weekly study by Advanced Web Ranking showed that as of January 5th, 2026, Google’s search engine produced an AI Overview on 60.2% of queried keywords,1 compared to only 12.4% as of July 2024.2
But the rise in AI summaries does not necessarily coincide with an increase in the accuracy of the underlying large language models (LLMs). According to some sources, the latest models actually show an increase in “hallucinations,” a phenomenon in which the LLM inserts fabricated information into a response.3 Estimates for the frequency of these errors vary by model and query type. One ongoing study that looks at GenAI’s ability to summarize an article found hallucination rates between 1.8% and 7.8% per summary among the top GenAI models.4 Even Google’s Gemini model, when asked how trustworthy AI summaries are, provided this reply: “Recent tests in 2025 indicated that roughly one in five AI Overviews may return inaccurate or misleading answers. … Accuracy drops significantly for specific, less-documented topics where the AI may fill “data voids” with off-base information.”5
What’s troubling is not only the tendency of AI-generated information to be wrong, but its tendency to be “confidently wrong.” A study published in the Columbia Journalism Review6 in March 2025 found that eight leading GenAI tools had a collective error rate of 60% when providing citation information that could have otherwise been easily found by clicking through the first few search engine results. The incorrect responses were often presented with complete confidence and no qualifying statements or expressions of uncertainty. While the tools self-filtered by declining to provide responses in some cases, this behavior differed across the tools. ChatGPT, for example, provided a response to every query despite a high error rate in its responses. In contrast, Microsoft Copilot declined to reply for over half the questions.
What this means for actuaries:
Consider just a few possible ways that actuaries may rely on search engines to directly inform their work:
- Searching for laws/regulations ASOPs related to insurance pricing or reserving.
- Searching for information on actuarial methodologies or exam syllabi topics.
- Searching for information related to emerging sources of risk for purposes of risk classification or for assessing the possibility of adverse deviation of reserves.
Many of these use cases are related to niche, less-documented topics — the sorts of topics in which GenAI itself confesses that it is particularly error prone.
As a result, actuaries should be particularly careful when using AI summaries from search engines. While it can be tempting to rely on an authoritative-sounding AI summary instead of clicking into search results to read the details of a primary source (e.g., DOI bulletin, statutory law, ASOP, CAS paper, etc.), these AI summaries should at most be used as a starting point, not a final destination, for information. How would an actuary feel if Microsoft Excel would fabricate a result instead of correctly executing a formula 1% of the time?
- https://www.advancedwebranking.com/free-seo-tools/google-ai-overview#faq
- https://www.advancedwebranking.com/blog/ai-overview-study
- https://www.nytimes.com/2025/05/05/technology/ai-hallucinations-chatgpt-google.html
- https://github.com/vectara/hallucination-leaderboard
- Ironically, Gemini did not cite the source of the test results.
- https://www.cjr.org/tow_center/we-compared-eight-ai-search-engines-theyre-all-bad-at-citing-news.php
Developing News
Reviewing ‘Ash’umptions: Another Look at Volcanic Risk
n November 23, 2025, the Hayli Gubbi volcano in Ethiopia reported its first recorded eruption, emitting over 220,000 tons of sulfur dioxide. High-altitude winds pushed the resulting ashfall as far as northern India, leading to the delay or cancellation of more than a dozen international flights. According to the local authority, settled ash made it difficult for local livestock to find clean grass and water. As human settlement expands into remote regions and global air traffic increases, events like this highlight important questions about whether existing catastrophe frameworks adequately reflect the evolving reach of volcanic activity and its impact on underwritten exposures.

What this means for actuaries:
It may be up for debate whether global volcanic activity is increasing in frequency, but its relevance to insurers may nonetheless be growing. Evolving exposure, complex coverage interactions, and increased global interdependence mean that a particularly situated, unexpected eruption could generate losses beyond its immediate footprint, including business interruption or supply-chain disruption. We cannot predict the next eruption; we can, however, refuse to be surprised by its financial consequences.
Sources
- https://www.smithsonianmag.com/smart-news/ethiopian-volcano-erupts-for-the-first-time-in-nearly-12000-years-of-scientific-records-180987764.
- https://apnews.com/article/ethiopia-volcano-afar-hayli-gubbi-flights-india-e9b4731d12787d7956f1ffbd16961f2a.
- https://science.nasa.gov/earth/earth-observatory/hayli-gubbis-explosive-first-impression/.
- https://www.theguardian.com/environment/2025/jul/08/climate-crisis-melting-glaciers-ice-caps-volcanic-eruptions-chile-antartica-volcanoes.
- https://www.nwinsurance.org/hot-topics/mount-st-helens-anniversary.
- https://volcano.si.edu/faq/index.cfm?question=historicalactivity.
- https://www.nature.com/articles/s43247-025-02208-1.
- https://environment.uw.edu/news/2025/04/the-pacific-northwests-most-active-underwater-volcano-is-getting-ready-to-erupt/.
- https://www.usatoday.com/story/graphics/2025/02/28/volcano-eruptions-2025-ring-of-fire/80463843007/.
- https://www.iii.org/article/volcanic-eruption-coverage.
Developing News
Autonomous Vehicles Hit Bumps in the Road
ecent policy and traffic roadblocks have the potential to slow autonomous vehicles’ (AVs) rollout in the U.S. and abroad. Early attempts at driverless vehicles such as Google’s Firefly or General Motors’ Cruise floundered and were discontinued, but these initiatives helped pave the way for today’s commercially viable entities such as Waymo, the Alphabet subsidiary whose robot taxis represent over a quarter of San Francisco’s rideshare market, and Zoox, their upstart competitor backed by Amazon. In China, over half of new vehicles have autonomous driving features similar to Tesla’s assistive AutoPilot and “Full Self-Driving” (FSD) technologies. Lemonade Insurance recently introduced rewards for FSD mileage into its usage-based rating plans due to “far fewer accidents.”
Despite these signs of progress, questions remain over AVs’ readiness for scale. AVs ground San Francisco to a halt in December 2025 when citywide blackouts darkened traffic lights. Waymo’s software was overloaded by novel information, such as more pedestrians crossing and other taxis in close proximity (who were also unsure what to do in the power outage), creating gridlock. Other recent reports of odd behavior include Waymo taxis stopping in front of oncoming trains and swerving into traffic. Because Tesla was an early innovator in FSD, the automaker has become a bellwether in National Highway Traffic Safety Administration (NHTSA) inquiries , specifically with regard to traffic violations and FSD’s ability to safely operate in low-visibility conditions. Waymo recently recalled several vehicles in Austin because they failed to stop for school buses, triggering an NHTSA evaluation. Still other issues of potential concern to regulators include remote backup drivers and deployment of service packs (e.g., software updates, bug fixes, security patches, etc.).

While regulators navigate the complexity, private citizens are taking to the courts. In September 2025 a Florida jury rendered a nine-figure verdict (primarily punitive) against Tesla over its alleged role in a 2019 accident involving Autopilot, where Tesla’s marketing was found to have contributed to the negligent driver’s false sense of security while he was inattentive at the wheel. Waymo must also defend suits related to its vehicles’ behavior; for example, whether the company is responsible for an incident in which two of its taxis impeded a bike lane and caused serious injury.
As injuries and litigation pile up, governments may start to pull back their support of self-driving vehicles. China’s Ministry of Industry and Information Technology significantly scaled down ambitious plans for driverless taxis after a recent fatal accident involving three university students. A draft federal bill in the U.S. aimed to improve competitiveness with China also met apprehension from stakeholders — including the insurance industry — in early 2026. The American Property Casualty Insurance Association and National Association of Mutual Insurance Companies raised concerns about the proposed federal legislation allowing self-driving vehicles to preempt state regulations. There are also concerns about limited access to vehicle data, which is needed to determine the risk profiles of these cars.
What this means for actuaries:
In 2018 the CAS Automated Vehicles Task Force delivered its flagship report. The authors suggested the need to consider potentially massive frequency reductions (e.g., Lemonade pricing premise); shifts from personal auto to product liability and related severity increases (e.g., the Tesla verdict); new or newly important risk factors (e.g., ceasing operations during blackouts or fog); and data sufficiency issues (e.g., whether AVs are on current software). Actuaries grappling with issues from assistive features to robotic fleet coverage would be well served to read (and evolve) the CAS report rather than riding out decades-old approaches on autopilot.
Sources
- https://www.act-news.com/news/waymo-incidents-trigger-nhtsa-review/.
- https://www.bloomberg.com/news/features/2026-01-06/are-autonomous-vehicles-safer-than-human-drivers-we-don-t-know-yet.
- https://www.caranddriver.com/news/a69849571/waymo-robotaxis-roadblocks-san-francisco-blackout/.
- https://www.casact.org/sites/default/files/2021-02/pubs_forum_18spforum_01_avtf_2018_report.pdf.
- https://www.fastcompany.com/90129372/firefly-googles-cute-self-driving-car-is-dead.
- https://www.insurancejournal.com/news/national/2026/01/16/854682.htm.
- https://www.insurancejournal.com/news/national/2026/01/21/855011.htm.
- https://www.latimes.com/business/story/2026-01-16/tesla-is-probing-if-its-self-driving-technology-caused-thousands-of-traffic-violations.
- https://www.local10.com/news/local/2025/08/04/this-is-a-warning-attorneys-say-expect-more-lawsuits-after-240m-tesla-autopilot-verdict/.
- https://www.nytimes.com/2025/11/18/technology/personaltech/zoox-driverless-taxis-san-francisco.html.
- https://people.com/passenger-forced-to-flee-self-driving-vehicle-after-stops-path-of-oncoming-train-11884070.
- https://people.com/waymo-passenger-films-scary-near-miss-in-self-driving-taxi-11870667.
- https://www.reuters.com/business/autos-transportation/us-auto-safety-agency-investigating-two-new-gm-cruise-crash-reports-2023-10-26/.
- https://www.reuters.com/business/retail-consumer/china-bets-europe-self-driving-tech-expansion-2025-10-06/.
- https://www.sfchronicle.com/bayarea/article/s-f-cyclist-sues-waymo-doored-robotaxi-20385289.php.
The Hidden Costs of Good Intentions: How Disaster Bailouts Shape Where We Live and What We Insure
hen a hurricane ravages the Gulf Coast or a wildfire tears through a hillside community in the West, the immediate aftermath is familiar and heartbreaking. Families return to ruined homes, neighborhoods are reduced to rubble, and emergency crews flood the area with supplies. Soon after, state and federal officials arrive with promises of relief — and the money follows. Billions of dollars are distributed each year to help people rebuild their lives. These efforts reflect an admirable national instinct: when disaster strikes, Americans do not leave one another behind.
Yet beneath the surface of this well-intentioned generosity lies an uncomfortable question — one that policymakers, economists, and environmental planners have increasingly struggled to confront. Does the predictable flow of government aid after natural disasters unintentionally encourage people to live in dangerous places? And does it lead many to remain uninsured or underinsured, assuming help will come regardless?
Across the country, from hurricane-prone coastlines to fire-susceptible forests and brushlands to riverside floodplains, the evidence suggests that the answer may be yes. That evidence spans population trends, insurance coverage patterns, repeated rebuilding after disasters, and the growing gap between private insurance markets and public support. Although disaster bailouts are rooted in compassion, they can distort incentives in ways that make communities more vulnerable over time.
What we mean by “disaster bailouts”
This system plays a vital role in helping communities recover. But its predictability matters. Over time, repeated cycles of disaster, declaration, and aid have created an expectation that substantial public support will follow major losses. That expectation is not limited to homeowners; it is embedded in local government planning, housing markets, and mortgage lending. The result is a system in which the financial consequences of living in hazardous areas are partially absorbed by society at large rather than borne entirely by those exposed to the risk.
Understanding disaster bailouts in this broader sense is essential, because it is this predictability — not the impulse to help — that shapes long-term Understanding disaster bailouts in this broader sense is essential, because it is this predictability — not the impulse to help — that shapes long-term.
A nation living closer to the edge
Coastal counties now hold nearly 40% of the U.S. population,6 even as rising seas, storm surges, and hurricanes grow more dangerous. In the West, sprawling development has pushed deep into the wildland–urban interface, placing millions of homes directly beside highly flammable vegetation.7 Floodplain development continues despite repeated warnings and devastating floods.8
As a result, the cost of natural disasters has skyrocketed. Federal disaster spending has more than doubled since the 1990s,9 and individual events can cost $10 billion or more.10 When disasters strike, agencies like FEMA and the Small Business Administration mobilize extensive financial support: cash grants for families, subsidized rebuilding loans, infrastructure repair, temporary housing, and long-term reconstruction aid. This support is essential for recovery. But it also has long-term consequences that are rarely discussed openly.
When help creates risk: The logic of public-sector moral hazard
Imagine two similar coastal towns with very different histories. In one, residents know they are largely on their own after a storm. Insurance requirements are stringent, and those who fail to insure risk devastating financial ruin. In the other, decades of generous disaster aid have created an unspoken expectation that government relief will arrive quickly and generously. In this second town, the psychological calculus subtly shifts. Insurance can feel less urgent, and compliance with building standards may weaken over time. The perception of risk fades, even though the physical danger remains unchanged. Over time, these dynamics accumulate, shaping not just individual behavior but entire housing markets and local policy decisions in disaster-prone regions.
This is not to say homeowners are reckless; few deliberately put themselves in harm’s way. Rather, incentives accumulate silently and collectively. If rebuilding after a disaster is made easier — emotionally, financially, and bureaucratically — then the cost of living in dangerous areas becomes artificially low. The risks become masked, not eliminated.
Why people move into disaster-prone areas
Population growth in hazardous areas is shaped by how risk is translated into market prices. In many coastal and flood-prone regions, long-term disaster exposure is only partially reflected in housing prices and insurance premiums. These homes appear reasonably priced to buyers relative to their amenities — such as ocean access or scenic views — even though their long-run risk is higher than market prices suggest. Government-subsidized insurance programs, such as the NFIP, have historically offered premiums well below what private insurers would charge,13 making floodplain living surprisingly affordable — often without buyers fully realizing the extent of the subsidy embedded in their mortgage. Economists describe this as risk mispricing;14 when the true cost of exposure is underpriced, development flows toward hazardous areas rather than away from them. For example, a homebuyer comparing a coastal property to an inland alternative may see manageable insurance premiums without realizing that those prices are shaped by public subsidies rather than true risk. The result is not an irrational decision, but one made based on incomplete or distorted information.
At the same time, behavioral factors reinforce these economic signals. Normalcy bias15 leads people to underestimate the likelihood of future disasters, even after experiencing one. As memories fade, optimism returns, and homeowners often justify rebuilding by emphasizing emotional attachment, natural beauty, or confidence that the next outcome will be different.
Local politics reinforces these trends. Because communities depend heavily on property tax revenue and development-driven economic growth, restricting building in high-risk zones can be deeply unpopular with voters, developers, and local governments alike.16 When these local incentives are combined with the expectation of federal disaster aid, these forces contribute to the continued expansion of communities into hazardous areas. This dynamic reflects the political economy of local land use, in which short-term fiscal and economic pressures often outweigh long-term risk considerations.
Why bailouts exist, and why they could be defensible
Insurance markets, too, are imperfect tools for managing these risks. Information asymmetry makes it difficult for homeowners to fully understand their exposure, while affordability constraints can price lower-income households out of coverage altogether. In some regions, private insurers have withdrawn or sharply reduced offerings,17 leaving residents with few viable alternatives. In these contexts, disaster aid is not merely compassionate; it is a practical response to market failure.
Seen this way, disaster bailouts are not inherently irrational. They can be efficient ex ante responses to rare but catastrophic risks, particularly when losses are highly correlated across households and regions. Large-scale disasters strain private insurance markets precisely because so many people are affected at once, making government intervention a form of risk pooling that spreads costs across taxpayers and over time in ways individual markets cannot.
Disaster policy also reflects classic collective action problems. Investments in mitigation — such as flood control, wildfire management, or resilient infrastructure — often benefit entire communities, but no single household has sufficient incentive to bear those costs alone. Left entirely to private decision-making, these investments tend to be underprovided, increasing vulnerability when disasters strike.
There is also a compelling macroeconomic argument for generous post-disaster assistance. Without rapid and substantial aid, disasters can trigger cascading effects: population displacement, collapse of local tax bases, loss of essential services, and long-term regional decline. Federal intervention helps stabilize communities, preserve economic continuity, and prevent localized shocks from spreading more broadly. From this perspective, disaster bailouts are not just acts of empathy but instruments of economic resilience.
These arguments are valid, and they help explain why unconditional aid remains politically durable and socially popular. Yet acknowledging their strength does not eliminate the underlying tension. While disaster assistance addresses immediate hardship and systemic failures, its current structure often does little to reduce future exposure and in some cases may inadvertently increase it. When aid repeatedly supports rebuilding in the same high-risk locations, or substitutes for adequate insurance and mitigation, it can mute the signals that would otherwise encourage adaptation or relocation.
The challenge, then, is not whether disaster victims deserve help — they clearly do — but whether the design of that help aligns short-term recovery with long-term risk reduction. Policies that emphasize rebuilding, without equally strong incentives for mitigation, insurance coverage, or relocation, can relieve immediate suffering while allowing future exposure to persist. The insurance market makes this tradeoff especially visible, as it is where public policy, private pricing, and individual decision-making converge.
Insurance: The critical but distorted market
Insurance is meant to be the tool that aligns personal decisions with actual risk. A homeowner in a fire-prone canyon or low-lying floodplain would, in a well-functioning market, pay higher premiums that reflect the true hazard. These costs would signal danger and encourage either adaptation — like reinforcing homes — or relocation.
Bailouts and subsidies can alter these market signals.
Many Americans living in high-risk zones are uninsured or underinsured, relying instead on the assumption that government aid will rescue them if disaster strikes. This is particularly evident in flood-prone communities, where only a small fraction of homeowners carry flood insurance,18 even though standard homeowners policies do not cover flood damage. Researchers studying experience-based learning19 have found that insurance demand rises sharply after disasters but declines over time as memories fade and perceived risk diminishes — a pattern that reinforces cycles of underinsurance.20
As part of this broader bailout framework, subsidized insurance programs amplify these effects. For decades, the NFIP charged rates that failed to reflect the growing reality of flood risk,13 allowing some properties to be rebuilt repeatedly at taxpayer expense in the same vulnerable locations. In policy terms, these repetitive-loss properties illustrate a classic moral hazard11 feedback loop: public support reduces the perceived cost of risk, which encourages additional development, increases exposure, and ultimately leads to larger and more frequent disaster losses that require even greater public intervention. Over time, this dynamic reinforces settlement patterns that are increasingly misaligned with environmental reality, locking households and governments into cycles of loss and recovery.
The withdrawal of private insurers from states like Florida and California highlights how distorted the market has become.21 As climate risks amplify and policy frameworks fail to address them, insurance companies are stepping back, unable to charge premiums high enough to offset growing losses. In their absence, state-backed insurance pools — or the federal government — become the insurers of last resort,22 further socializing risk that would otherwise shape individual choices.
Who pays the real price?
This is not the result of manipulation or opportunism. Most Americans in disaster-prone regions simply follow the incentives placed before them. They may not know they are living in a subsidized risk zone. They may not realize that their community’s building codes were shaped by local politics rather than regional hazard analysis. They may assume that because aid has always come, it always will.
Still, the effect is to shift the cost of living in hazardous locations from the individual to society at large. Over time, this creates a growing financial burden that raises long-term concerns about sustainability and equity.
Compassion without chaos: Rethinking disaster policy
One approach is to require adequate insurance coverage as a condition for receiving disaster aid. Several countries already do this,24 and it ensures that homeowners share responsibility for preparing for foreseeable risks. Another approach is to price insurance premiums based on actual danger, a reform that the NFIP has begun implementing with its new Risk Rating 2.0 methodology.25
Why this debate matters now
This reality makes the current debate especially urgent. As climate risks intensify, federal policymakers are moving to scale back disaster assistance by raising the threshold for presidential disaster declarations and shifting more recovery costs to states.27 Recent analysis suggests that many past disasters would no longer qualify for federal aid under these changes, transferring tens of billions of dollars in costs to state and local governments just as hurricanes, wildfires, and floods grow more frequent.
The aim of reform is not to punish those who live in hazardous places. It is to prevent a system in which disaster after disaster pushes communities into a cycle of loss and rebuilding, where the same homes are destroyed repeatedly and where the financial burden grows heavier for everyone.
As climate change accelerates, the cost of inaction becomes more severe. The question is not whether we should help disaster victims — morally, compassion demands it. The question is how to provide that help in ways that do not inadvertently magnify future tragedies.
A path forward
We must decide whether our current system is truly helping people rebuild their lives or simply helping them rebuild in the path of the next storm. The future will bring more fires, more storms, more floods, and more displacement. The question is whether our policies will continue to channel people toward danger or guide them to safer ground.
Balancing compassion with foresight may be one of the most difficult challenges in climate and disaster policy. But meeting that challenge is essential if we hope to build a future where recovery is measured not just in dollars spent and houses rebuilt, but in lives protected, communities strengthened, and risks genuinely reduced.
References:
- https://www.congress.gov/crs-product/R48310
- https://www.sba.gov/funding-programs/disaster-assistance
- https://www.everycrsreport.com/reports/IF12811.html
- https://www.climatecentral.org/climate-matters/billion-dollar-disasters-2025
- https://www.oxfordeconomics.com/resource/americans-are-flocking-to-metros-with-a-high-risk-of-natural-disasters/
- https://coast.noaa.gov/states/fast-facts/economics-and-demographics.html
- https://research.fs.usda.gov/treesearch/
- https://pmc.ncbi.nlm.nih.gov/articles/PMC11687735
- https://www.pgpf.org/article/what-is-the-disaster-relief-fund
- https://www.cbo.gov/publication/58840#
- https://www.sciencedirect.com/topics/economics-econometrics-and-finance/moral-hazard
- https://link.springer.com/article/10.1007/s41885-024-00141-9
- https://neptuneflood.com/research/transitioning-nfip-policies-to-the-private-market-a-path-to-a-more-efficient-flood-insurance-landscape/
- https://journalofcrr.com/research/03-07-gourevitch-et-al/
- https://www.clearerthinking.org/post/normalcy-bias-definition-examples-and-effects
- https://www.china-ces.org/Files/3058abstract/202501120427414441.pdf
- https://today.ucsd.edu/story/impact-of-wildfires-on-home-insurance
- https://jencapgroup.com/insights/personal-lines/flood-insurance-trends-approaching-2026
- https://pubmed.ncbi.nlm.nih.gov/27576946/
- https://www.researchgate.net/publication/228467138_Learning_About_an_Infrequent_Event_Evidence_from_Flood_Insurance_Take-Up_in_the_US
- https://www.newamerica.org/future-land-housing/briefs/insurance-in-florida-lessons-for-california/
- https://climateandcommunity.org/research/insurers-of-last-resort
- https://www.undrr.org/news/billions-trillions-flagship-un-report-reveals-true-cost-disasters-and-how-reduce-them
- https://www.ecfr.gov/current/title-44/chapter-I/subchapter-D/part-206/subpart-I
- https://www.fema.gov/flood-insurance/risk-rating
- https://www.zurich.com/knowledge/topics/climate-change/is-managed-retreat-a-viable-response-to-climate-risk
- https://www.urban.org/urban-wire/proposed-cuts-federal-disaster-assistance-will-hit-states-just-hurricane-season-ramps
Rethinking Loss Triangles for IFRS 17: How the Risk Attribution Index (RAI) Reveals the Limits of Frequency–Severity–Inflation Decomposition
ince IFRS 17 went live, insurers have been asked to explain what drives reserve movements in addition to forecasting them. Boards, auditors, and supervisors now expect narrative clarity on the respective roles of frequency shifts, severity trends, and inflationary pressure. Yet many actuaries know the uncomfortable truth: traditional loss triangles were never designed for this kind of decomposition and often cannot support it mathematically.
The Risk Attribution Index (RAI) was introduced to address this gap. Originating from causal-inference methods used in epidemiology and adapted for actuarial data, RAI evaluates whether a triangle contains enough independent structure to support reliable attribution.
In short: RAI tells you when the data themselves allow attribution — and when they do not.
What the RAI actually measures
RAI is neither a model nor a new reserving technique. It is a data diagnostic that measures whether frequency, severity, and inflation leave distinct mathematical signatures inside a triangle. If the patterns overlap too closely, the triangle becomes non-identifiable; even the most sophisticated models cannot separate the effects. This is a frequent problem in inflation-dominated environments, where severity drift, settlement behavior, and economic inflation increasingly mimic each other.
How the RAI emerges from the data
The computation follows three steps:
Step 1: Extract the raw structural variation.
Think of a triangle as containing three overlapping fingerprints:
- Frequency changes leave row-wise patterns (same accident year across all development periods).
- Severity shifts create diagonal or year-over-year cost level changes.
- Inflation produces smooth, calendar-time gradients that affect all years similarly.
RAI measures how distinct these fingerprints are. When frequency drops 20% in one accident year while severity rises 15% and inflation adds 8%, can we tell which drove the total change? Only if their “fingerprints” don’t overlap.
Step 2: Measure how distinguishable these components are
If two components move in parallel (for example, severity rising at the same rate as inflation), they produce collinearity and reduce identifiability. In the RAA triangle, all three fingerprints smudge together — frequency movements correlate –0.66 with severity changes, making them nearly indistinguishable.
Step 3: Combine these measures into a single index.
- RAI < 0.5: reliable attribution.
- 0.5–1.0: attribution possible but uncertain.
- 1.0: attribution structurally impossible.
The crucial point is this: RAI evaluates the data, not the modeler. Even a perfect model cannot decompose what the data do not separate.
Why RAI matters for IFRS 17 governance
RAI enables teams to say: “This quarter’s triangle has RAI = 0.82 — the data permit partial but uncertain attribution,” or, “RAI = 1.10 — attribution is mathematically impossible; any decomposition would be narrative only.” This protects the organization against overconfidence, model-driven illusions of precision, and audit challenges, while improving cross-functional transparency between pricing, finance, and risk departments.
Exhibit 1: Correlation Heatmaps for RAA (Left) and CAS (Right) Datasets
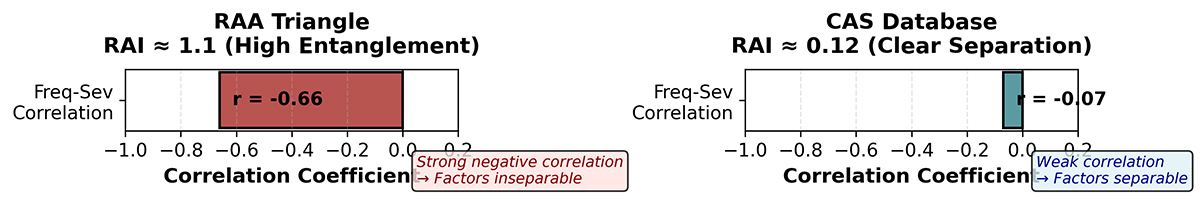
Exhibit 2: Attribution Fan Plots Showing Factor Contributions with Uncertainty Intervals

Applications: What RAI reveals in real triangles
The RAA triangle: A case of masked dynamics.
The RAA triangle exhibits strong collinearity among frequency, severity, and inflation effects. Development-year gradients resemble cost trends, cost shifts mimic inflation, and frequency changes overlap with both.
A correlation heatmap of the RAA triangle reveals why attribution fails (Exhibit 1, left). Frequency and severity show a –0.66 correlation — when one rises, the other falls, creating mirror-image patterns. Development-year effects correlate –0.50 with frequency, and severity-inflation shows –0.32. These deep correlations in the heatmap visualize mathematical entanglement: the data contain a single composite signal, not three separable ones. These “masked dynamics” produce a high RAI ≈ 1.1, indicating that the data do not contain enough variation to uniquely distinguish drivers.
Any decomposition will produce unstable or contradictory estimates. The fan plot for RAA (Exhibit 2, bottom) shows this visually: all three factors (frequency, severity, and inflation) receive near-identical attributions (mean ≈ 33.3% each) with wide, overlapping uncertainty intervals. No factor can be distinguished from the others.
Why this matters
RAI shows when these narratives rest more on professional intuition than on empirical signal.
CAS loss reserve database: Clearer structural separation.
In contrast, many triangles in the CAS database show heterogeneous development patterns:
- Frequency shocks appear as isolated discontinuities.
- Severity shifts manifest in specific accident years.
- Inflation creates smooth year-over-year gradients.
These patterns do not mimic each other, creating room for reliable statistical separation. The CAS correlation heatmap (Exhibit 1, right) shows pale correlations throughout — frequency-severity correlation is only –0.07, frequency-inflation is –0.38, and severity-inflation is –0.17. Each driver varies independently, creating the structural separation needed for attribution.
The resulting RAI ≈ 0.12 indicates strong identifiability:
- Driver-level attribution is stable.
- Different modeling approaches converge to similar decompositions.
- Uncertainty bands are narrow enough to inform governance decisions.
The CAS fan plot (Exhibit 2, top) demonstrates differentiated attribution: frequency contributes approximately 32% of total claim evolution, severity dominates at 58%, and inflation adds 10%. Uncertainty intervals are non-overlapping, indicating reliable separation. The severity factor’s dominance is consistent with industry knowledge that average claim costs drive aggregate loss trends more strongly than claim counts in mature insurance markets.
Practical takeaway
The CAS triangle demonstrates what “attribution-ready” data looks like.
The importance of detecting masked dynamics
- Postpandemic volatility in claim settlement.
- Supply-chain-driven severity inflation.
- Wage-push inflation affecting bodily injury claims.
- Economic inflation altering both cost levels and payment timing.
Without a diagnostic like RAI, actuaries risk assigning narrative explanations to patterns that are mathematically inseparable. RAI formalizes what many practitioners intuitively suspect: some triangles simply cannot tell us the story we are asking them to tell.
Implications for the actuarial profession
RAI does not replace models. It tells actuaries when modeling can legitimately answer attribution questions — and when it cannot.
For IFRS 17, this has three direct implications:
- Audit-ready transparency
Teams can annotate each quarter’s triangle with an explicit identifiability statement: “Q3 triangle RAI = 0.45 — frequency (35%), severity (52%), inflation (13%)” versus “Q4 triangle RAI = 1.20 — drivers non-separable, combined effects narrative provided.” - Governance integrity
Attribution narratives become aligned with what the data support, preventing the common pitfall of misinterpreting noise as signal. - Better resource allocation
When RAI is high, teams know not to overengineer model refinements that cannot overcome fundamental data limitations. Resources can be redirected to scenario analysis or additional data collection.
Conclusion
- Low RAI → reliable attribution.
- Medium RAI → proceed with caution.
- High RAI → attribution not possible; narrative only.
As the industry moves toward stronger governance and more transparent explanations, RAI offers a simple, rigorous, and reader-friendly diagnostic that helps ensure the profession speaks with clarity only where the data allow clarity.
From Hype to Help: A Practical GenAI Workflow for Actuaries
question I hear often is: “Generative AI (GenAI) sounds great on paper, but how do we apply it as an actuary?” The most practical answer I have found is to use GenAI as a research assistant rather than an answer oracle. Our work is already retrieval heavy. We spend a large amount of time navigating PDFs — rating manuals, statistical plans, filings, and study materials — revisiting the same paragraph, confirming what it says, and stitching together related points across documents. If GenAI can reduce that search friction while keeping sources visible, it quickly becomes useful.
To address that, I leaned on a common GenAI technique called Retrieval-Augmented Generation (RAG). The experience is chatbot-like, but answers are based on your documents and include citations of the passages used. If the answer is not in the material, it says so. The rest of this article walks through that workflow using a small Python prototype and study materials as an example. The same workflow can apply to other documents.
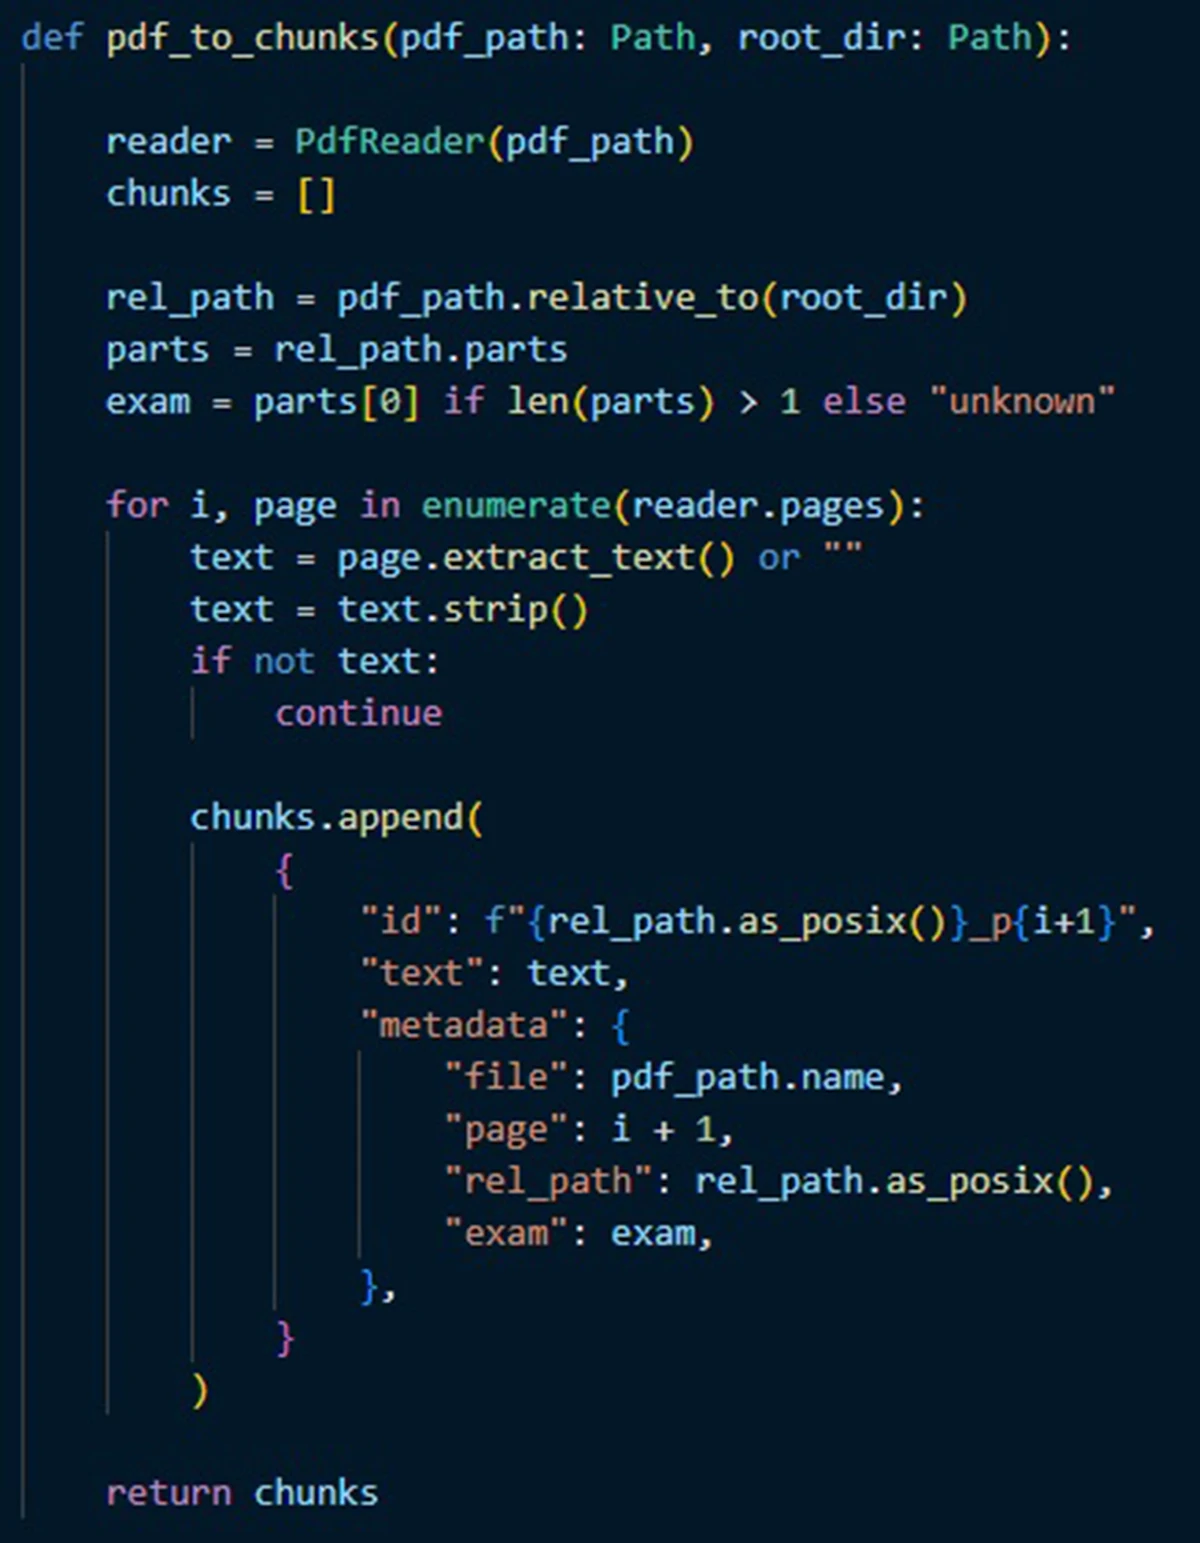
Step 1: Curate and index (ingestion)
I start with a small set of PDFs and confirm the text is extractable. Text-based PDFs can be searched as they are. Scanned PDFs or image-only documents usually need an optical character recognition (OCR) scan, which converts images of pagers into searchable text, and in some cases a multimodal model can extract the text directly.
Next is chunking, the process of splitting up a long document into shorter pieces to facilitate processing. In the simple setup I have, each page is treated as a chunk. That keeps citations straightforward and makes a good starting point. If retrieval later pulls too much unrelated context from dense pages, longer pages can be split into smaller chunks or given light overlap. Either way, page numbers and file names are stored with every chunk, so citations are automatic.
Finally, embeddings are created for each chunk and stored in an index. Embeddings are numeric representations of text that enable semantic search because two pieces of text that have similar meanings are mapped to numerical representations that are “close” to each other. This means that a question can match the right passage, even when it uses different wording than the source.
At the end of Step 1, I have a library that can answer the question: “Which passages from my documents are most relevant to what I just asked?”
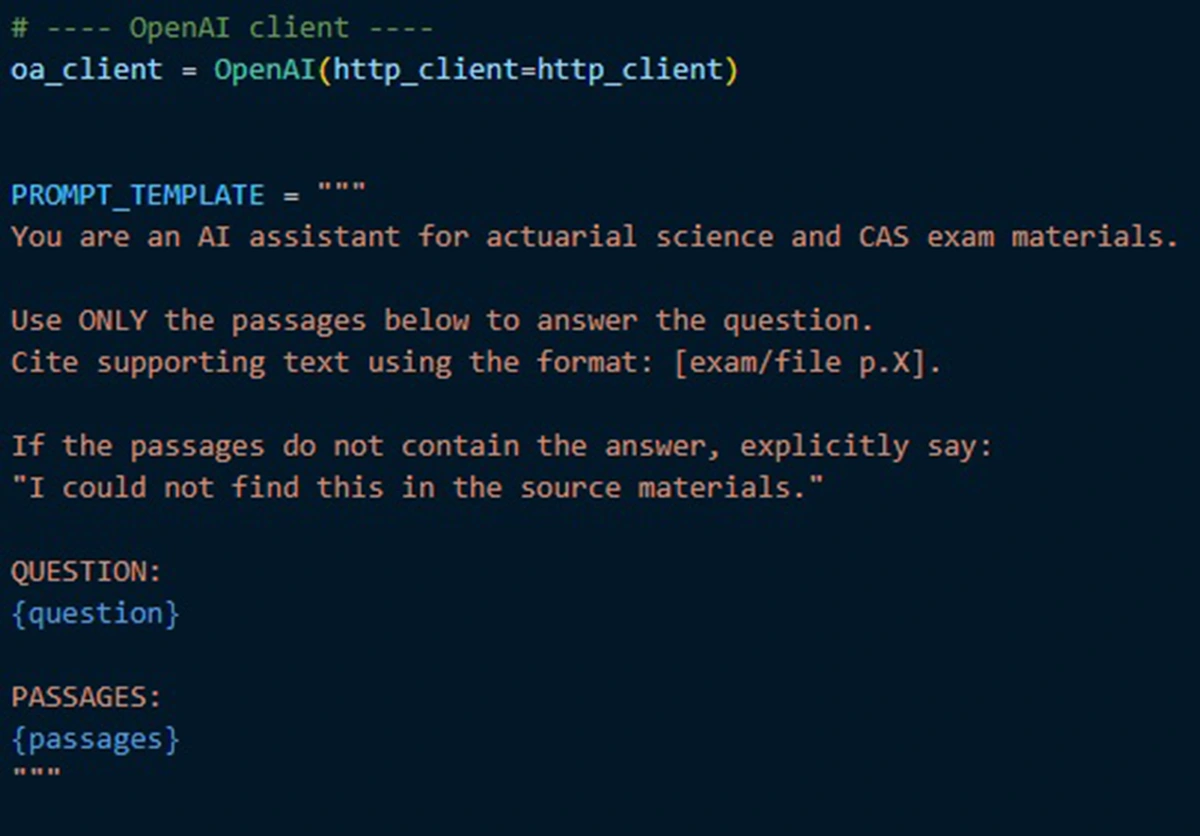
Step 2: Retrieve and draft (question answering)
The key design choice is restraint. In my setup, the instruction prompt is intentionally boring. It says:
- “Use only the provided passages to answer the question.”
- “Cite supporting text using a consistent page format.”
- “If the passages do not contain the answer, say so explicitly.”
These constraints reduce hallucination risk.
A practical note on model choice: there are two separate decisions here, embeddings and drafting, and they can be mixed and matched. Embeddings often run locally, while the drafting step can use either a local model or a model hosted by a third party (such as OpenAI or Google Gemini) and accessed via API. Hosted models are often the fastest path to strong writing quality, and the request is typically encrypted in transit. But the retrieved passages and question still go off-machine, so it is important to follow company guidance on data handling. Cost is typically modest because only a handful of passages are sent per question, and while pricing scales with the size of the model’s input and outputs, good retrieval discipline helps keep costs under control. Local models may suffer in quality or require a bit more setup, but they keep everything on your own machine, which can simplify data handling. Either way, the workflow stays the same: retrieve first and then draft from what was retrieved.
Optional Step 3: Add a simple (or nice!) user interface (UI)
For a small team, the interface can be as simple as a lightweight Python web app (e.g., Streamlit or Gradio), a notebook UI (Jupyter), or a FastAPI endpoint that can also feed into Teams or Slack.
What worked, what didn’t, and the one rule of thumb
The guideline I use is simple: “Can’t see the source? Don’t trust the answer.” Used this way, RAG becomes a practical entry point for actuaries: faster research, better synthesis, and the same accountability we already hold ourselves to.
A New Way to Model Catastrophes in a Changing Climate
hen Dr. Kip Rotich was growing up in Nakuru, Kenya, the weather was on his side. The predictable rainy season meant that his family’s homestead could produce enough food to be self-sufficient, plus more in reserve. Now the rains are heavier and more damaging, with longer dry spells between.
“These days,” he says, “we’d be lucky to harvest a tenth of that, if any.”
Now as an actuary and quantitative analyst specializing in weather modeling, Rotich realized this wasn’t just family misfortune. It was also a data problem. How do you build and validate a catastrophe model when data is sparse and the future climate looks nothing like the past?
Rotich’s recently published Variance article, “An Application of Image Processing Techniques in the Calibration of Catastrophe Models,” suggests that neural networks trained on maps of historical storms may hold the key.
Classic methods exist to model natural catastrophes, which are, thankfully, still relatively infrequent events. One method uses generalized linear models (GLMs). These may produce reasonable results for perils like wind and hail, where data is plentiful, but struggle with hurricanes and other rare events.

But these models are only as reliable as the data and assumptions behind them.
Rotich writes, “…catastrophic weather-related events keep occurring more often than the current catastrophe models can predict.” Therefore, companies must calibrate the models based on knowledge of exposure changes, climate change, and their unique portfolios.
This model calibration often includes comparing an “out-of-the-box” vendor catastrophe model to company historical results and to simpler GLMs (tuned to the company’s book of business) and making ultimate selections for the relevant risk metric indications. Those comparisons and selections are then used to true-up the vendor catastrophe model.
Rotich suggests that using a neural network instead, which can be trained directly on images, may provide several distinct advantages in calibration: 1) it replaces entire ensembles of GLMs while requiring less computing power, 2) it produces robust results even when data is sparse, and 3) it outperforms GLMs across most metrics.
To make this approach accessible, Rotich includes a primer in his paper designed to “demystify” neural networks, particularly convolutional neural networks (CNNs). CNNs are the standard architecture for breaking an image into pixels and using specialized calculations to turn groups of pixels into modeling features. A subcategory of CNNs is CNNs with a U-net architecture — essentially a CNN with better “memory” that preserves image context that is lost in the standard CNN.
Data gathered from NOAA is used to create maps of catastrophic events (technically called 2D histograms), color coded by how frequently the event happens in a particular zone. The authors then evaluate the model using a rolling six-month forecast window, starting in 1950. This rolling series of maps is fed into the U-net CNN, which produces another 2D histogram as an output.
As Rotich viewed these maps, something clicked. “Catastrophe risk isn’t just about how much rain falls, but where and how the storm moves…tracking this movement gives a far more granular understanding,” he realized.
The U-net predictions can then be compared against output from catastrophe models and GLMs. Rotich found the U-net outperformed the GLM across most standard model metrics (MAE, Precision, Accuracy, etc.): “It was one of those moments where you think: OK, this isn’t just a proof of concept. There’s something genuinely powerful here.”
It also did a better job at picking up and predicting cyclicality of events when compared to the GLM, especially when the number of events was expected to be close to zero (which the GLM tends to overpredict). U-nets do this without being explicitly programmed to do so. Traditional GLMs, by contrast, “treat events as numbers,” Rotich explains. “They don’t see the shape or progression of a storm.”
More research remains. Rotich envisions linking hazard models to claims outcomes, testing newer architectures, and most importantly, accessing better data. “If I could get anything, it would be long, high-resolution, continuous spatial weather datasets such as radar, satellite, etc. That would unlock an entirely new level of precision,” Rotich says.
The U-net approach may prove particularly valuable for insurers entering new markets or testing catastrophe model assumptions against recent climate trends. For actuaries navigating catastrophic risk — whether in Kenya’s shifting rainy seasons or the Great Plains’ Tornado Alley — Rotich’s approach offers a way forward when the past is no longer indicative of the future.
Coming Soon: The CAS AI Primer
- Provide a concise overview of AI concepts and applications relevant to actuarial work.
- Highlight potential risks and outline best practices for responsible AI use.
- Outline key corporate and regulatory considerations that shape AI implementation in actuarial contexts.
- Direct readers to trusted learning resources for building deeper AI literacy and practical skills.
Ethical Issues
Applicability Guidelines in Practice: A Reference Guide
ach day we go to work, whether we’re consciously thinking of it or not, our actions are governed by ASOPs. To uphold quality and professional standards, we need to be mindful of the ASOPs relevant to the emails we write, analyses we perform, and reports we distribute. As of the date of writing this article, there are 52 active ASOPs. For some of these standards, it can be easy to see whether they apply to your area of practice. For example, a P&C reserving actuary wouldn’t find it particularly useful to review ASOP 2, Nonguaranteed Elements for Life Insurance and Annuity Products. However, for other standards it can be more ambiguous; in these cases, we can use the Applicability Guidelines (AGs) as a reference.
The AGs are published by the Council on Professionalism and Education of the American Academy of Actuaries and aim to help actuaries consider which ASOPs may provide guidance to them based on the scope of their role. These are not definitive statements on what generally accepted practices apply to a specific task and should not replace the actuary’s professional judgment. So where can you find these elusive AGs? They are on the American Academy of Actuaries website; just click on the Professionalism tab > Actuarial Standards of Practice > Applicability Guidelines. You can also get to them directly at https://actuary.org/resources/applicability-guidelines-for-actuarial-standards-of-practice/.
Even though the AGs will download as a spreadsheet workbook, it should really be read as a document consisting of five pages.
The first page, or tab, titled “Cover,” includes important information on when the last revision was performed. As of this writing, the document was last revised in October 2025.
On the second tab, titled “Introduction,” there are a few important definitions and comments on how ASOPs are referenced in the AGs. The most important thing to know is that the AGs only include ASOPs and is a tool to help us identify relevant ASOPs based on the work involved. It does not suggest references or give guidance regarding other publications, such as those produced by the Financial Accounting Standards Board or the National Association of Insurance Commissioners that may be important to actuaries working on particular assignments. Furthermore, other technical documents such as monographs, practice notes, or other informational resources from the American Academy of Actuaries will not be referenced.
After that, you will find four tabs, titled “Casualty, Life, Health, and Pension” — these are the four major practice areas, but we will of course only focus on the “Casualty” tab.
On the “Casualty” tab, we can find that work assignments are broken down in to seven major categories: 1) appraisals; 2) data management; 3) enterprise risk management; 4) expert advice, witness, and/or testimony; 5) financial analysis, projections, and reporting; 6) product development/ratemaking/pricing; and 7) reserving. Some of these include sub-categories, where you can drill down even more. And reading across the rows are the ASOPs that the actuaries should consider reviewing as they may be relevant to their work.
At the top of the page, you will find that there are three ASOPs that apply to all practice areas: ASOP 1, Introductory Actuarial Standard of Practice; ASOP 23, Data Quality; and ASOP 41, Actuarial Communications. We will briefly explore each of these common ASOPs that apply to all work assignments.
When assessing the reserves for a large insurer, a consulting actuary may decide to not review the insurer’s personal auto physical damage reserve due to the size of the reserve and the short-tail nature of the line of business. As the actuary determined that a misstatement in these reserves wouldn’t influence the decision of an intended user, they are in compliance with ASOP 1.
ASOP 23 is the second ASOP that applies to all assignments in all practice areas. This ASOP covers data quality and applies when an actuary is selecting data, performing a review of data, and relying on data supplied by others when performing actuarial services. It also applies to selecting and preparing data that an actuary believes will be used by other actuaries, or when making appropriate disclosures with regard to data quality. When selecting data, an actuary is following best practices when they are considering the appropriateness of the data, consistency with relevant external information that is readily available and known, limitations of the data, and availability of additional and alternative data.
In their workday, a reserving actuary may use professional judgment to determine whether to review data for reasonableness and consistency. They determine that claim counts are defined as closed-with-pay plus open and that reopened claims are not coded as additional claims. They also summarize unresolved questionable negative incremental paid values and determine that this impact is immaterial. After doing this, they feel their review is sufficient and proceed to use the data.
A pricing actuary at the same company is given an assignment that uses data supplied by their colleagues in claims. Even though the accuracy and completeness of the data supplied by others are the responsibility of those supplying the data, the actuary still determines whether to review, and use, the data. After deciding to use the data, the actuary discloses this reliance in an appropriate actuarial communication.
ASOP 41 is the third ASOP that applies to all assignments in all practice areas. This ASOP covers actuaries who are issuing actuarial communications within any practice area. It does not apply to communications that do not include an actuarial opinion or other actuarial findings (e.g., brochures, fee quotes, or invoices). It does provide guidance for preparing actuarial communications, including those that may be required by the Qualification Standards or other ASOPs.
The performance of a specific actuarial engagement or assignment typically requires significant and ongoing communication between the actuary and the intended users.
The actuary should complete an actuarial report if they intend the findings to be relied upon by any intended user. The report should state the actuarial findings and identify the methods, procedures, assumptions, and data used with sufficient clarity that another actuary qualified in the same practice area could make an objective appraisal of the reasonableness of the actuary’s work as presented in the actuarial report.
A report should also include certain disclosures as appropriate: uncertainty of risk, any conflicts of interest, reliance on others, the responsible actuary, identification of actuarial documents, scope of the report, limitations, subsequent events, etc.
Of course, if the actuary departs from the guidance of this ASOP to comply with applicable laws, statutes, regulations, etc., the actuary should refer to Section Four regarding deviation.
You should be able to recognize similarities between the examples above and the tasks you routinely complete. While these three ASOPs span any role you’ll find yourself in, the AGs are a great resource to help you consider what ASOPs may apply more specifically to your role.
How often do you reference the AGs? We want to hear your thoughts at ar@casact.org.
It’s a Puzzlement
The Slippery Ring
frictionless ring contains N identical beads spaced evenly around it. Each second, every bead independently jumps one position clockwise or counterclockwise with equal probability. If two or more beads land on the same position, they instantly merge into a single bead at that position. The process continues forever.
Question:
Extra credit: How does the answer grow as N grows to infinity?


To Freeze Or Not To Freeze?
If the vending machine temperature were in the range of –1°C to 0°C, diet sodas would freeze and regular ones would remain liquid. This is due to the scientific phenomenon of freezing point depression, whereby the freezing temperature of a solution decreases as more solute is dissolved (the boiling point is likewise elevated). Ordinary water would have a freezing point of 0°C. In the U.S. market, a 12 oz. can of regular Mountain Dew has 46g of sugar (fructose, molar weight = 180g), or 0.255 mol. For ordinary water, this would translate to a molality of 0.255 mol / (12 oz. = 0.355 kg) = 0.72 molal. This in turn depresses the freezing point by 0.72 m * (–1.86°C / m) = –1.3°C. Other brands such as Sprite, Dr Pepper, Coke, and Pepsi have less sugar, but it is still in the upper 30s of grams. On the other hand, a 12-oz. can of Diet Coke would contain only about 200mg of aspartame, which furthermore has a much larger molar weight of 294g. The resulting freezing point depression is (0.2 g / 294 g/mol) / (0.355 kg) * (–1.86 °C / m) = –0.004 °C, basically unchanged from regular water.
Solutions were also submitted by Daniel Aarhus, Bob Conger, Daniel Heyer, Fresa Luo, Sean Porreca, John Noble, and Chris Shatto.
Know the answer? Send your solution to ar@casact.org.

Obtain Your Credentials in Predictive Analytics and Catastrophe Risk Management From The CAS Institute

Certified Catastrophe Risk Management Professional (CCRMP) and Certified Specialist in Catastrophe Risk (CSCR)

Required assessments and courses for earning the CSCR include:
- Property Insurance Fundamentals
- Catastrophe Risk in the Insurance Industry
- Introduction to Catastrophe Modeling Methodologies
- The Cat Modeling Process
- Online Course on Ethics and Professionalism
Some exam waivers are available for specific prior courses and exams.
Certified Specialist in Predictive Analytics (CSPA)
Required assessments and courses for earning the CSPA include:
- Property-Casualty Insurance Fundamentals
- Data Concepts and Visualization
- Predictive Modeling — Methods and Techniques
- Case Study Project
- Online Course on Ethics and Professionalism
Some exam waivers are available for specific prior courses and exams.